How to create dynamic interactive charts in Excel?
Sometimes, when you demonstrate data by using a chart, you might encounter a situation that there is a lot of data to be presented. Making a chart to compare multiple sets of data, the chart may look mussy and chaotic. But with the help of an interactive chart, you can choose a particular product and analyze its performance and trend. For example, to show the data series in the chart based on a drop-down list, when selecting one item from the drop down, your corresponding data will be showed in the chart as below demo.
This article, I will talk about creating an interactive chart by using the drop-down list, radio buttons and checkbox.

Create a dynamic interactive chart by using the drop-down list
Create a dynamic interactive chart by using the radio buttons
Create a dynamic interactive chart by using the checkboxes
Create a dynamic interactive chart by using the drop-down list
To create the dynamic interactive chart by using a drop-down list, please do with the following steps:
1. First, you should insert a drop-down list form, please click Developer > Insert > Combo Box (Form Control), and then draw a combo box as below screenshots shown:
 |
 |
2. Then, right click the combo box, and select Format Control from the context menu, see screenshot:

3. In the Format Object dialog box, under the Control tab:
- In the Input range text box, select the data range in the data table exclude the column heading(A2:I6);
- In the Cell link text box, select an empty cell assigned for storing the drop-down menu output (B8);
- In the Drop down lines box, enter the number of data points in your data set (in this case, 5).

4. Then, click OK button, now, the product names have been added into the drop-down, and the linked cell value (B8) characterizes the currently selected item from the menu as option 1, 2, 3, 4 or 5, see screenshot:

5. And then, copy the header of the original data, and leave an empty row for displaying the filtered sales data, see screenshot:

6. Enter the following formula into A12 and copy it across to I12, and it returns the value in the row which number corresponds to the currently selected item in the drop-down list, see screenshot:
Note: In the formula, A2:A6 is the first column data of your original data, and B8 is the cell linked to the combo box.
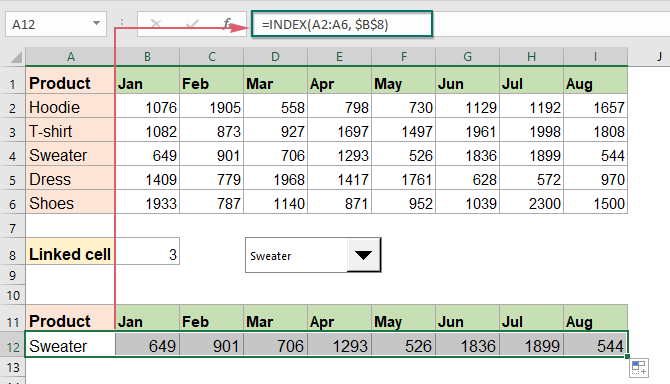
7. This step, you can create a chart based on the new helper data (A11:I12), please select this data and then insert a chart as you need, see screenshot:
8. At last, if you want to put the drop-down list on the top of the chart, please right click the combo box, and select Order > Bring to Front, see screenshot:

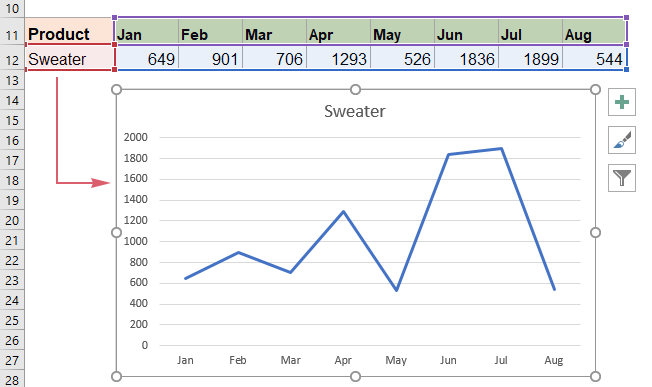
9. Then, drag the combo box on top of the chart, now, when you choose one option from the drop-down list, the corresponding data series will be displayed in the chart as below demo shown:
Create a dynamic interactive chart by using the radio buttons
If you want to show the data series in the chart based on the radio buttons, please do as this:
1. First, please insert the radio buttons, click Developer > Insert > Option Button (Form Control), see screenshot:

2. And then, draw several radio buttons based on your product names, here, I will draw 5 radio buttons, and rename them as the product names, see screenshot:

3. Then, right click on any of the radio buttons and select Format Control, see screenshot:

4. In the popped out Format Object dialog box, under the Control tab, click a blank cell to assign for storing the radio button output (B8). See screenshot:

5. Now, the linked cell value (B8) characterizes the currently selected radio button as option 1, 2, 3, 4 or 5, see screenshot:

6. After inserting the radio buttons, now, you should prepare the data for creating chart, please copy the row and column headers from the original table, and paste them into another place, see screenshot:

7. Then, enter the below formulas, and you will get the following data, see screenshot:
In cell B13: =IF($B$8=2,B3,NA()), and copy this formula into the entire row;
In cell B14: =IF($B$8=3,B4,NA()), and copy this formula into the entire row;
In cell B15: =IF($B$8=4,B5,NA()), and copy this formula into the entire row;
In cell B16: =IF($B$8=5,B6,NA()), and copy this formula into the entire row.
Note: In the above formulas, B8 is the cell linked to the radio button, 1,2,3,4,5 in each formula means the number linked to the radio buttons, B2, B3, B4, B5, B6 in each formula indicates the first data in each row that you want to display from the original table.

8. After preparing the data, then, please select the new data range (A11:I16), and insert a chart as you need, and now, the interactive chart is crated completely, when select one radio button, its corresponding data series will be displayed in the chart as below demo shown:

Create a dynamic interactive chart by using the checkboxes
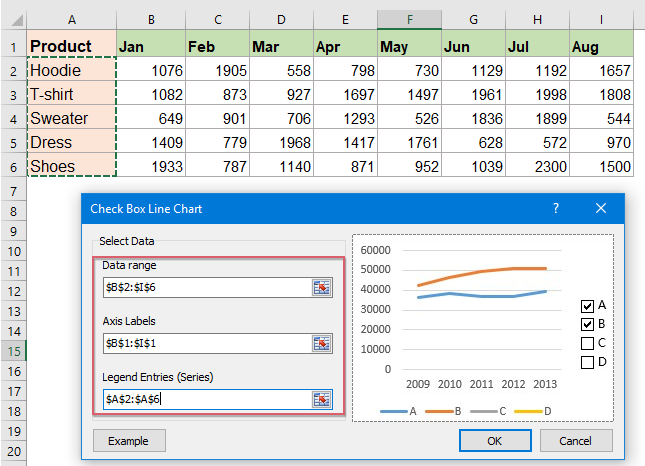
The above method can only show one data series of the chart each time, if you need to show two or more data series each time, you can create an interactive chart with check boxes. If you have Kutools for Excel, with its Check Box Line Chart feature, you can generate a dynamic interactive line chart with check boxes in Excel. At the same time, you can decide which lines to be displayed in the chart by just checking the corresponding check boxes.
After installing Kutools for Excel, please do as this:
1. Click Kutools > Charts > Category Comparison > Check Box Line Chart, see screenshot:

2. In the Check Box Line Chart dialog box, do the following operations:
- In the Data range box, select the data series you will display in the chart;
- In the Axis Labels box, select the axis labels data;
- In the Legend Entries (Series) box, select the data you will display as the chart legend (where the checkboxes display).
3. After finishing the settings, please click OK button, and a dynamic interactive chart is created successfully, you can check or uncheck the checkboxes to show or hide the data series in the chart based on your need. See the below demo:

More relative articles:
- Create Box And Whisker Chart In Excel
- In Excel, a box and whisker chart, also named as box plots is used to display the statistical analyses which helps to show you how numbers are distributed in a set of data. For example, with the help of the box and whisker chart, you can display the statistical data of test scores between different subjects to identify which subject need more attention for the students. In this article, I will talk about how to create a box and whisker chart in each version of Excel.
- Create Speedometer Or Gauge Chart
- A gauge chart, also named as dial chart or speedometer chart which looks like a speedometer in cars using a needle to show information as a reading on a dial, when the data changes, the needle moves dynamically as well as below screenshot shown. In Excel, a gauge chart is composed of two Doughnut charts and a Pie chart, it shows the minimum, maximum and current values in the dial. It can be used for presenting sales performance of representatives or work completed as against total work or other situations with a visualization way. This article, I will talk about how to create a gauge or speedometer chart in Excel step by step.
- Create A Column Chart With Percentage Change In Excel
- In Excel, you may create a simple column chart for viewing the data trends normally. For making the data looks like more intuitively to display the variances between the years, you can create a column chart with percentage change between each column as below screenshot shown. In this type of chart, the up arrows indicate the increased percentage that the later year than the previous year while the down arrows indicate the decreased percentage.
- Create Project Status Spectrum Chart In Excel
- This tutorial will talk about how to create an especial chart – project status spectrum chart in Excel. The project status spectrum chart is a type of bar chart with a slider block which the bar is filled as a spectrum from red to yellow to green to represent the project status as below screenshot shown.
Best Office Productivity Tools
Supercharge Your Excel Skills with Kutools for Excel, and Experience Efficiency Like Never Before. Kutools for Excel Offers Over 300 Advanced Features to Boost Productivity and Save Time. Click Here to Get The Feature You Need The Most...
")
Office Tab Brings Tabbed interface to Office, and Make Your Work Much Easier
- Enable tabbed editing and reading in Word, Excel, PowerPoint, Publisher, Access, Visio and Project.
- Open and create multiple documents in new tabs of the same window, rather than in new windows.
- Increases your productivity by 50%, and reduces hundreds of mouse clicks for you every day!
")