How to create a bi-directional bar chart in Excel?
Supposing you have two sets of data as the below screenshot shown and want to visually compare them in a chart, in this case, a bi-directional bar chart can do you a favor. A bi-directional bar chart is used for comparing two sets of data side by side along a vertical axis. This tutorial demonstrates two methods to help creating a bi-directional bar chart in Excel.

Create a bi-directional bar chart in Excel (multi-steps)
Easily create a bi-directional bar chart in Excel (several clicks)
Create a bi-directional bar chart
By default, Excel does not provide a direct build-in function to create a bi-directional bar chart. You need to apply different formattings to a clustered bar chart until it turns to a bi-directional bar chart. So the steps are fussy and not easy to handle, please follow the below steps.
1. Select the whole data range you will create a bi-directional bar chart based on, and then click Insert > Insert Column or Bar Chart > Clustered Bar.

2. Then a clustered bar chart is inserted into the worksheet. Right click any one of the bars and select Format Data Series from the right-clicking menu. See screenshot:

3. In the Format Data Series pane, choose the Secondary Axis option under the Series Options tab.

Now you can see a secondary axis is added on the chart as the below screenshot shown.

4. Select and right click this secondary axis, and then choose Format Axis from the context menu.

5. In the Format Axis pane, you need to configure as follows.
Tips: As the Maximum here is 7000, the minimum should be -7000.

Now the chart is shown as follows.
6. Select and right click the X-axis, and then select Format Axis from the right-clicking menu.

7. In the Format Axis pane, change the Minnimum and Maximum to the same minimum and maximum values we specified for the secondary axis in step 5.

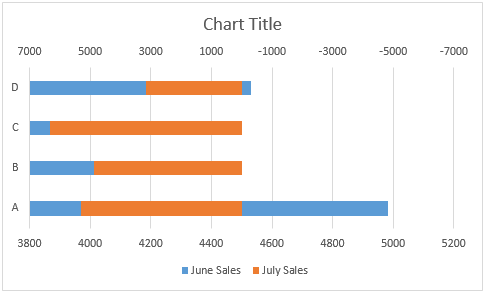
Now a bi-directional bar chart is clear as the below screenshot shown.

8. As the Y-axis is displayed almost in the middle of the chart, we need to move it to the left side of the chart. Just click to select the Y-axis, go to the Format Axis pane, and then choose Low from the Label Position drop-down list in the Labels section. See screenshot:

9. Now you need to widen the bars. Select one of the series in the chart, go to the Format Data Series pane, and then change the percentage in the Gap Width box.
Repeat the steps to widen the bars on the other side.

Then you can see the chart is displayed as follows.

10. Add data labels to the bars. Select one of the series in the chart, and then click the Chart Elements > Data Labels > Inside End. See screenshot:
Repeat the steps to add data labels to the series on the other side.

Remove or change the chart title as you need. Then a bi-directional bar chart is complete as the below screenshot shown.

Easily create a bi-directional bar chart in Excel with an amazing tool
If the above method is too fuzzy and time-consuming for you to handle, here highly recommended the Bidirectional Bar Chartutility of Kutools for Excel for you. With this utility, you can easily create a bi-directional bar chart in Excel with several clicks only.
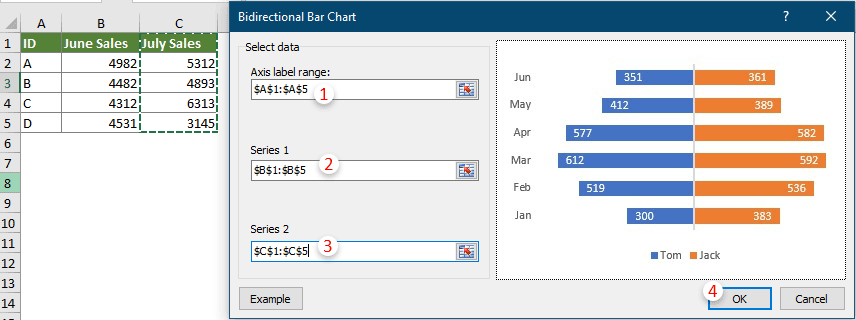
1. Click Kutools > Charts > Category Comparison > BiDirectional Bar Chart.

2. In the popping up Bidirectional Bar Chart dialog box, please specify different ranges in corresponding boxes and finally click the OK button.
Tips: You can select the whole data range firstly and then apply this feature, then ranges will be recognized and displayed in corresponding boxes automatically.
Then a bi-directional bar chart is complete as the below screenshot shown.

If you want to have a free trial (30-day) of this utility, please click to download it, and then go to apply the operation according above steps.
Related Articles:
Best Office Productivity Tools
Supercharge Your Excel Skills with Kutools for Excel, and Experience Efficiency Like Never Before. Kutools for Excel Offers Over 300 Advanced Features to Boost Productivity and Save Time. Click Here to Get The Feature You Need The Most...
Office Tab Brings Tabbed interface to Office, and Make Your Work Much Easier
- Enable tabbed editing and reading in Word, Excel, PowerPoint, Publisher, Access, Visio and Project.
- Open and create multiple documents in new tabs of the same window, rather than in new windows.
- Increases your productivity by 50%, and reduces hundreds of mouse clicks for you every day!
All Kutools add-ins. One installer
Kutools for Office suite bundles add-ins for Excel, Word, Outlook & PowerPoint plus Office Tab Pro, which is ideal for teams working across Office apps.
- All-in-one suite — Excel, Word, Outlook & PowerPoint add-ins + Office Tab Pro
- One installer, one license — set up in minutes (MSI-ready)
- Works better together — streamlined productivity across Office apps
- 30-day full-featured trial — no registration, no credit card
- Best value — save vs buying individual add-in