How to make a histogram chart in Excel?
Histogram chart is usually used to show the distribution of the data as a statistical chart. If you want to know the detail steps about making a histogram chart in Excel, you can read this tutorial.
Make a histogram chart
In Excel, if you want to make a histogram, you need to do two steps first.
1. Specify the bins of the data. The scale of the bins is limited in the scale of the data. For example, I have a list of grade, and the scale of the grade is from 0 to 100, and now I specify my bins as shown as below screenshot:

Tip: The bins are usually specified as consecutive, non-overlapping intervals of a variable. The bins (intervals) must be adjacent, and usually equal size.
2. Then you need to add the Data Analysis add-in. Click File > Options (or click the Office Button at the upper-left corner > Excel Options in Excel 2007); then in the Excel Options dialog, click Add-Ins tab, then click Go in the right section. See screenshot:

3. In the Add-Ins dialog, check Analysis ToolPak option, and click OK to close the dialog.

Note: In Excel 2007, it will pop up a dialog box telling you have not installed the add-in. Just click the Yes button.
4. Go to Data tab and click Data Analysis function. Then in the popped out dialog, select Histogram and click OK. See screenshots:
 |
 |
5. Then in Histogram dialog, select the data range and the bin range, and specify the output place, and check all the last three options. See the below screen shot:

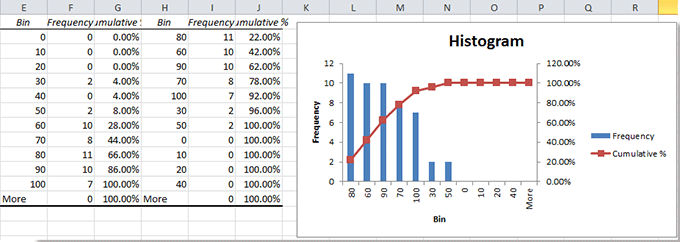
6. Click OK. Now you can see a histogram chart and a report are inserted and shown as below:
Relative Articles:
- Create dot plot in Excel
- Create bi-directional bar chart
- Create radar chart/spider chart
- Create doughnut chart in Excel
Best Office Productivity Tools
Supercharge Your Excel Skills with Kutools for Excel, and Experience Efficiency Like Never Before. Kutools for Excel Offers Over 300 Advanced Features to Boost Productivity and Save Time. Click Here to Get The Feature You Need The Most...
Office Tab Brings Tabbed interface to Office, and Make Your Work Much Easier
- Enable tabbed editing and reading in Word, Excel, PowerPoint, Publisher, Access, Visio and Project.
- Open and create multiple documents in new tabs of the same window, rather than in new windows.
- Increases your productivity by 50%, and reduces hundreds of mouse clicks for you every day!
All Kutools add-ins. One installer
Kutools for Office suite bundles add-ins for Excel, Word, Outlook & PowerPoint plus Office Tab Pro, which is ideal for teams working across Office apps.
- All-in-one suite — Excel, Word, Outlook & PowerPoint add-ins + Office Tab Pro
- One installer, one license — set up in minutes (MSI-ready)
- Works better together — streamlined productivity across Office apps
- 30-day full-featured trial — no registration, no credit card
- Best value — save vs buying individual add-in