How to sum every n rows down in Excel?
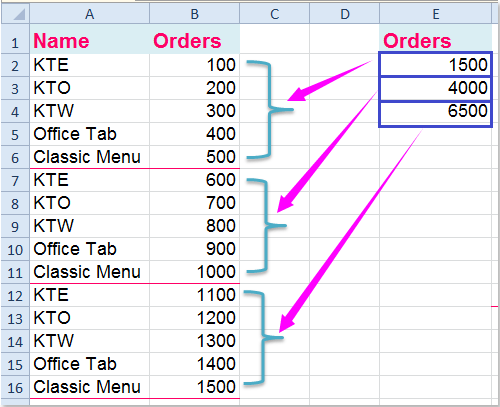
Suppose you have a lengthy data column in your worksheet, and your task is to sum every next 5 rows—specifically, using calculations such as =SUM(B2:B6), =SUM(B7:B11), and so forth—placing each result in a separate output column, as shown in the example screenshot. Manually carrying out this operation, especially for large datasets, can be time-consuming and error-prone. Below, this article introduces several practical approaches to efficiently and accurately sum every n rows, including formulas, handy utilities in Kutools for Excel, VBA macros, and Pivot Table techniques. You’ll find guidance on applicable scenarios, parameter adjustments, and troubleshooting to ensure a fluent workflow in your data summarization tasks. Explore the suitable solution for your necessities from the options below.
Sum every n rows down in Excel with formulas
Sum every n rows down in Excel with Kutools for Excel
Sum every n rows down in Excel with formulas
For illustration, if your requirement is to sum each group of5 rows in a dataset, you can construct and apply a formula to execute the calculation automatically. This method is flexible and immediate, suitable for dynamic data or when no add-in is available; however, formulas may require adjustment if your data structure changes significantly.
1. Input the following formula in a blank cell where you’d like to display the result of the first set (for example, in cell C2):
=SUM(OFFSET($B$2,(ROW()-ROW($B$2))*5,0,5,1))
Tip: In the formula above, B2 is the starting cell for your data (change as needed to match your data range), and 5 specifies the grouping size (number of rows per block to sum). For other intervals, such as every 10 rows, simply substitute 5 with 10 throughout the formula.
2. After entering the formula, use the fill handle to drag it down through the column, producing the sum for each n-row group. Continue until a zero appears, indicating all data blocks have been processed. See screenshot:

Parameter explanations and tips:
- OFFSET($B$2,…): Shifts the reference down by a multiple of the grouping interval. Adjust the absolute reference to the start of your dataset as needed.
- ROW()-ROW($B$2): Returns a sequential index (0 for the first group,1 for the second, etc.). Ensure you start filling from the correct row, or adjust accordingly.
- Formula output may show 0 for group calculations beyond your data range; this is normal and just indicates you’ve reached the end.
Notes:
1. In some cases, you may want the sum result—rather than being placed in a separate column—to appear at the end of each n-row block in-line with the data, for example, in column C as shown below:

To achieve this, apply the formula below (assuming your first value is in B1 and you want to sum every 5 rows) in C1 and drag down:
=IF(MOD(ROW(),5),"",SUM(OFFSET(B1,,,-5)))This places the sum on every nth row only. Notes: This formula requires your dataset to start in the first row of the worksheet. Adjust references if your data begins on a different row.
2. For row-based (horizontal) data where you want to sum every n columns, use this formula in the target cell (for example, C1):
=SUM(OFFSET($A$1,,(COLUMNS($A$3:A3)-1)*5,,5))Here, A1 marks the starting cell, A3 is where you place this formula, and 5 is the column interval you want to sum. Drag the fill handle rightward as needed. Refer to the screenshots below for further illustration:
 |
 |
 |
If you encounter incorrect results, double-check your absolute and relative references. Adjust the grouping size and cell references for your actual data location.
Sum every n rows down in Excel with Kutools for Excel
Kutools for Excel offers a convenient way to sum every n rows without manually constructing formulas. This is especially practical for large datasets or when you seek batch subtotal calculations. The utility utilizes page breaks and subtotals, streamlining repetitive tasks and minimizing formula errors. Note that this approach is available to users with the Kutools add-in installed.
To implement this method, follow these steps:
1. Click Kutools Plus > Printing > Insert Page Break Every Row. See screenshot:

2. In the Insert Page Break Every Row dialog box, specify the row interval to insert page breaks (e.g.,5), and then click OK. The tool will automatically insert page breaks every set number of rows in your dataset. See screenshot:

3. Next, go to Kutools Plus > Printing > Paging Subtotals:

4. In the Paging Subtotals dialog box, select the column header(s) you want to sum, and choose the calculation method (Sum, Average, etc.) as needed. Click OK to proceed. See screenshot:

5. All groups of n rows will now have their totals displayed in the output as desired. See screenshot:

If you need to remove the page breaks afterwards, you can select Remove All Page Breaks under the Kutools Plus Printing dropdown. If data has been changed after applying subtotals, you may need to repeat the process to refresh results.
Download and free trial of Kutools for Excel Now!
Sum every n rows down in Excel with Pivot Table grouping
A Pivot Table solution is particularly beneficial for users comfortable with Excel’s data analysis tools, who wish to summarize data blocks visually and optionally explore further breakdowns. By adding an auxiliary column to index groupings, you can aggregate the sum of every n rows without formulas or macros. This method is advantageous for quickly analyzing or presenting grouped data, though it requires a one-time setup for the helper column.
Applicable in scenarios such as sales by time period, batch processing, or summarizing sequential data blocks for reporting.
Steps:
- Create a helper column in your data (for example, in column C) with the following formula in C2, assuming your data starts from row 2 and you want to sum every 5 rows:
=INT((ROW(B2)-ROW($B$2))/5)+1- Drag the formula down for all rows. This creates a unique group index for each block of 5 rows.
- Next, select your dataset including this new group column and insert a Pivot Table (Insert > PivotTable).
- In the PivotTable Field List, drag the Group field (the helper column) to the Rows area, and drag the value column to the Values area, set to Sum.
- The Pivot Table will display the sum for each block of n rows according to your group indexing.
For grouping by other intervals, adjust 5 to your target value in the helper column formula. Deleting or inserting rows in your data may require updating the helper column and refreshing the Pivot Table. If results appear incorrect, check the grouping index formula and ensure the FIELD LIST is set up as above.
This approach is ideal for iterative reporting, data aggregation, or comparing block-wise results, and requires no formulas to be maintained in the main calculation area once set up. For dynamic datasets, simply recalculate the helper column and refresh the Pivot Table to update results.
Sum every n rows down in Excel with VBA code
Using a VBA macro is an efficient way to batch sum every n rows and automatically output results to a specified column or range. This is especially helpful for advanced users handling massive datasets or when you require regular, repeatable processes. With VBA, the process becomes more customizable, but it does require you to enable macros and have a basic understanding of the VBA editor interface. Take care to select the correct range and output location to avoid overwriting data.
1. Press Alt + F11 to open the Microsoft Visual Basic for Applications editor. In the editor, click Insert > Module to create a new module, and copy the following code into the module window:
Sub SumEveryNRows()
    Dim srcRange As Range
    Dim resultCol As Range
    Dim nRows As Integer
    Dim outRow As Long
    Dim i As Long
    Dim sumVal As Double
    Dim lastRow As Long

    On Error Resume Next
    xTitleId = "KutoolsforExcel"

    Set srcRange = Application.InputBox("Select the data range to sum:", xTitleId, "", Type:=8)
    If srcRange Is Nothing Then Exit Sub

    Set resultCol = Application.InputBox("Select the top cell where to output the results:", xTitleId, "", Type:=8)
    If resultCol Is Nothing Then Exit Sub

    nRows = Application.InputBox("How many rows per sum?", xTitleId, 5, Type:=1)
    If nRows < 1 Then Exit Sub

    lastRow = srcRange.Rows.Count
    outRow = 0

    For i = 1 To lastRow Step nRows
        sumVal = Application.WorksheetFunction.Sum(srcRange.Cells(i, 1).Resize(Application.WorksheetFunction.Min(nRows, lastRow - i + 1), 1))
        resultCol.Offset(outRow, 0).Value = sumVal
        outRow = outRow + 1
    Next i
End Sub2. Return to Excel, then press the F8 key, or click Run.
- The macro will prompt you to select your data area to sum (e.g., B2:B101).
- Next, select the top cell for where you’d like to output the sums (commonly in a blank column, e.g., C2).
- Enter the desired rows per group (for example,5).
The macro will calculate the sum of every n rows and output each result consecutively in your specified output column. If the last group contains fewer than n rows, it will sum whatever rows remain. If you select the wrong cell, you can cancel the operation or re-run the macro. This approach is flexible and well-suited for repetitive or automated summarization needs.
Tips and troubleshooting:
- Always back up your data before running macros to avoid unexpected changes.
- Make sure macros are enabled in your workbook (File > Options > Trust Center).
- If you encounter permission errors, check for worksheet protections or range restrictions.
Related articles:
How to sum values based on text criteria in Excel?
How to sum cells with text and numbers in Excel?
Best Office Productivity Tools
Supercharge Your Excel Skills with Kutools for Excel, and Experience Efficiency Like Never Before. Kutools for Excel Offers Over 300 Advanced Features to Boost Productivity and Save Time. Click Here to Get The Feature You Need The Most...
Office Tab Brings Tabbed interface to Office, and Make Your Work Much Easier
- Enable tabbed editing and reading in Word, Excel, PowerPoint, Publisher, Access, Visio and Project.
- Open and create multiple documents in new tabs of the same window, rather than in new windows.
- Increases your productivity by 50%, and reduces hundreds of mouse clicks for you every day!
All Kutools add-ins. One installer
Kutools for Office suite bundles add-ins for Excel, Word, Outlook & PowerPoint plus Office Tab Pro, which is ideal for teams working across Office apps.
- All-in-one suite — Excel, Word, Outlook & PowerPoint add-ins + Office Tab Pro
- One installer, one license — set up in minutes (MSI-ready)
- Works better together — streamlined productivity across Office apps
- 30-day full-featured trial — no registration, no credit card
- Best value — save vs buying individual add-in