Generate random number by given certain mean and standard deviation in Excel
Generating a set of random numbers with a specified mean and standard deviation is a common requirement in areas such as statistical simulation, testing algorithms, or modeling processes in fields like finance, engineering, and education. However, Excel does not provide a direct built-in function to instantly generate such a random number list tailored to both a given mean and standard deviation. If you frequently need to create randomized test data that statistically matches particular characteristics, knowing how to achieve this can greatly enhance your workflow efficiency and data quality.
In this tutorial, we will introduce practical ways to generate random numbers based on the mean and standard deviation you specify, with detailed step-by-step instructions, explanations of formula parameters, and expert tips for error prevention and troubleshooting. Additionally, we provide a VBA macro solution for users who need to automate this process or generate large datasets efficiently.
Generate random number by given mean and standard deviation
VBA Code - Generate random numbers with specified mean and standard deviation
 Generate random number by given mean and standard deviation
In Excel, you can create a set of random numbers that fit your desired mean and standard deviation by applying a combination of standard functions. Follow these steps for a solution suitable for small to moderate-sized datasets or quick, ad-hoc needs:
1. First, enter your target mean and standard deviation into two separate empty cells. For clarity and organization, let's say you use cell B1 for your required mean and cell B2 for your required standard deviation. See screenshot:
2. To create the initial randomized data, go to cell B3 and enter the following formula:
=NORMINV(RAND(),$B$1,$B$2)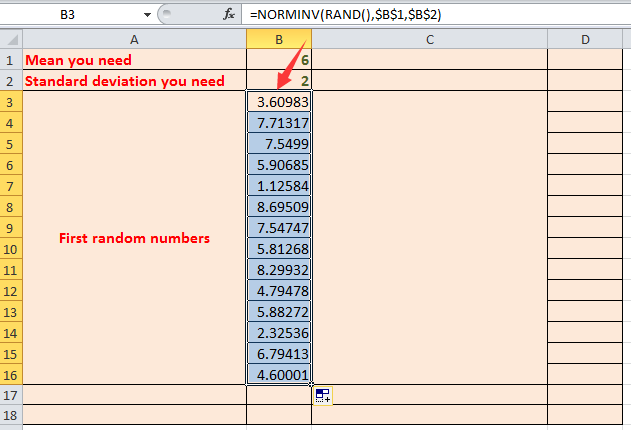
Tip:Within the formula =NORMINV(RAND(),$B$1,$B$2):
- RAND() produces a different random probability between 0 and 1 each time the worksheet recalculates.
- $B$1 refers to the mean value you have specified.
- $B$2 refers to the desired standard deviation.
=NORM.INV(RAND(),$B$1,$B$2), which is functionally the same but reflects updated function names. 3. To verify that your generated numbers statistically resemble your intended mean and standard deviation, use the following formulas to calculate the actual values of your generated sample. In cell D1, calculate the sample mean with:
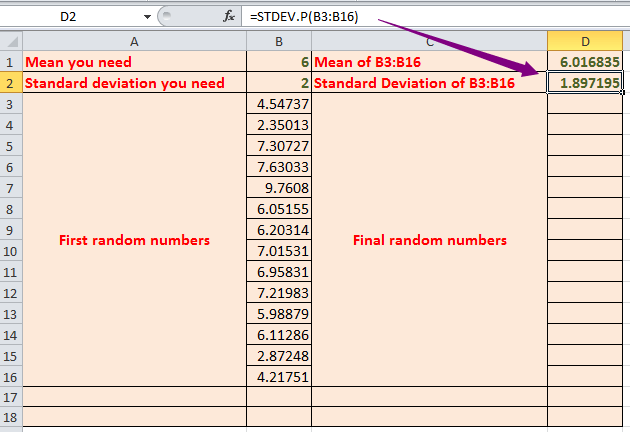
=AVERAGE(B3:B16)=STDEV.P(B3:B16)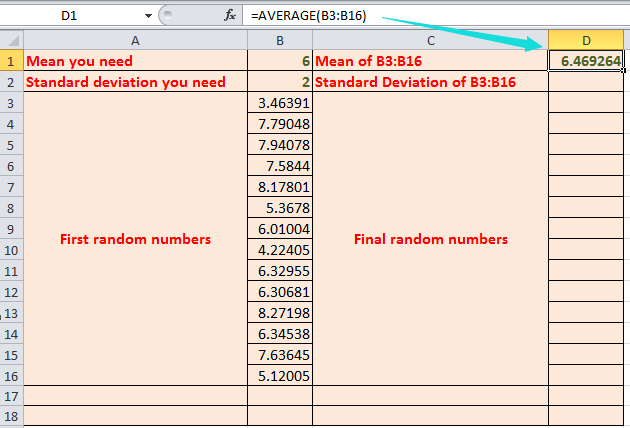
Tip:
- B3:B16 is just an example range. Adjust it according to how many random values you generated in Step2.
- A larger random sample results in an actual mean and standard deviation closer to your specified values, due to the law of large numbers.
4. To further adjust your series so that it matches your exact intended mean and standard deviation, normalize your initial random values. In cell D3, enter the following formula:
=$B$1+(B3-$D$1)*$B$2/$D$2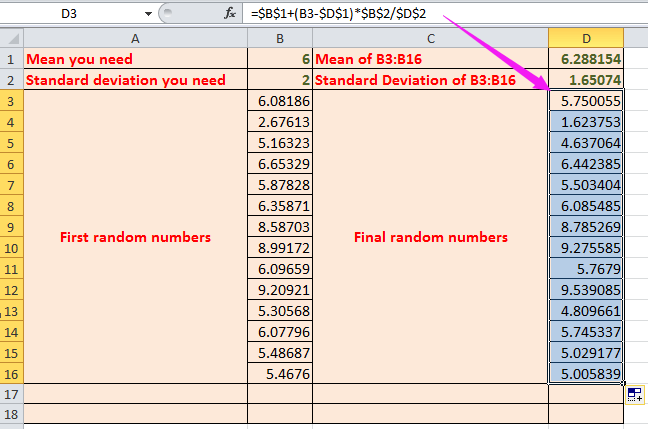
Tip:
- B1 is your required mean.
- B2 is your required standard deviation.
- B3 is the original random value.
- D1 is the mean of those original random values.
- D2 is the standard deviation of those original random values.
You can now confirm that the final set of values meets your requirements by recalculating their mean and standard deviation for quality assurance and documentation purposes.
5. In cell D17, compute the mean of your final random number set with the following formula:
=AVERAGE(D3:D16)=STDEV.P(D3:D16)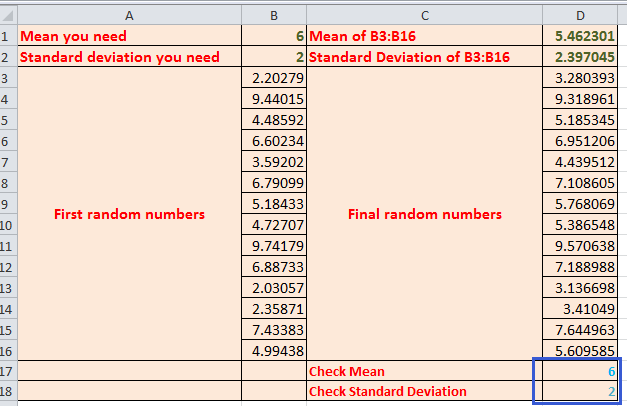
Tip: D3:D16 refers to your finalized random numbers range.
Troubleshooting:
- If you see a #VALUE! error, double-check all referenced cell ranges and ensure no formulas reference blank or invalid cells.
- If the formula keeps changing every time you recalculate, select the final random numbers, copy them, and use Paste Special > Values to prevent further updates.
- Remember that random generators in Excel rely on recalculation, so saving static results is necessary when consistency is critical.
VBA Code - Generate random numbers with specified mean and standard deviation
For scenarios where you need to quickly produce a large amount of random data matching specified mean and standard deviation—especially in repetitive, automated, or high-volume cases—a VBA macro offers a time-saving solution. With just a single execution, you can create a full dataset directly in your workbook, reducing manual repetition and minimizing formula copying errors.
This approach is suitable for:
- Automatically generating random datasets for simulations, stress testing, or educational demonstrations.
- Situations where you want to standardize output format with minimal manual intervention.
- Users comfortable with using the VBA Editor in Excel.
Compared to formula methods, VBA can also allow dynamic adjustments or integration with more complex workflows, but be mindful that macros must be enabled in your workbook and may require explicit saving in "macro-enabled" .xlsm format.
1. On the Excel ribbon, click Developer Tools (if not visible, enable it via File > Options > Customize Ribbon), then select Visual Basic. In the Visual Basic for Applications window, click Insert > Module, and copy the following code into the empty module window:
Sub GenerateRandomNumbersWithMeanStd()
    Dim outputRange As Range
    Dim meanValue As Double, stdDevValue As Double
    Dim numItems As Long, i As Long
    Dim xTitleId As String

    On Error Resume Next
    xTitleId = "KutoolsforExcel"

    Set outputRange = Application.InputBox("Select the output range", xTitleId, Type:=8)
    meanValue = Application.InputBox("Enter the mean value", xTitleId, "", Type:=1)
    stdDevValue = Application.InputBox("Enter the standard deviation", xTitleId, "", Type:=1)

    If outputRange Is Nothing Or meanValue = 0 Or stdDevValue = 0 Then
        MsgBox "Please ensure you have specified all required parameters.", vbExclamation, "KutoolsforExcel"
        Exit Sub
    End If

    numItems = outputRange.Count
    Randomize

    For i = 1 To numItems
        outputRange.Cells(i).Value = Application.WorksheetFunction.NormInv(Rnd, meanValue, stdDevValue)
    Next i
End Sub2. Click the ![]() Run button (or press F5) to launch the macro. A dialog box will prompt you to select the range where you want to output the random numbers (for example, select A1:A100 for 100 values). Next, you will be asked to enter the desired mean and standard deviation. The macro will fill the range with random numbers matching your specifications.
Run button (or press F5) to launch the macro. A dialog box will prompt you to select the range where you want to output the random numbers (for example, select A1:A100 for 100 values). Next, you will be asked to enter the desired mean and standard deviation. The macro will fill the range with random numbers matching your specifications.
Tips and Troubleshooting:
- VBA uses Excel's
NormInvfunction to generate normally distributed numbers—always double-check if your version supports this; for older Excel versions, the function might need to beNORMINV. - The random seed is set with
Randomizefor varied results in each run. - If you want reproducible results, comment out or remove the
Randomizeline. - The macro will overwrite any existing data in the selected output range, so ensure you choose an empty area if needed.
- If you input inappropriate values (for instance, a negative or zero standard deviation), the macro will not proceed and will show a warning message.
Relative Articles:
- Generate random numbers with no repeat in Excel
- Generate positive or negative random numbers in Excel
- Stop changing random numbers in Excel
- Generate random yes or no in Excel
Best Office Productivity Tools
Supercharge Your Excel Skills with Kutools for Excel, and Experience Efficiency Like Never Before. Kutools for Excel Offers Over 300 Advanced Features to Boost Productivity and Save Time. Click Here to Get The Feature You Need The Most...
Office Tab Brings Tabbed interface to Office, and Make Your Work Much Easier
- Enable tabbed editing and reading in Word, Excel, PowerPoint, Publisher, Access, Visio and Project.
- Open and create multiple documents in new tabs of the same window, rather than in new windows.
- Increases your productivity by 50%, and reduces hundreds of mouse clicks for you every day!
All Kutools add-ins. One installer
Kutools for Office suite bundles add-ins for Excel, Word, Outlook & PowerPoint plus Office Tab Pro, which is ideal for teams working across Office apps.
- All-in-one suite — Excel, Word, Outlook & PowerPoint add-ins + Office Tab Pro
- One installer, one license — set up in minutes (MSI-ready)
- Works better together — streamlined productivity across Office apps
- 30-day full-featured trial — no registration, no credit card
- Best value — save vs buying individual add-in