
How to calculate average/compound annual growth rate in Excel?

This article is talking about ways to calculate the Average Annual Growth Rate (AAGR) and Compound Annual Growth Rate (CAGR) in Excel.


Calculate Compound Annual Growth Rate in Excel

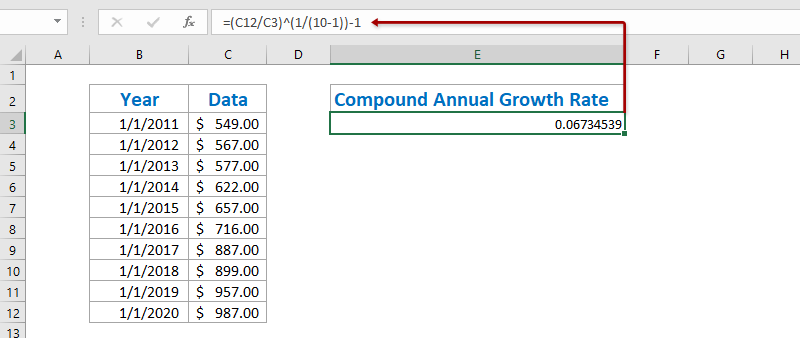
To calculate the Compound Annual Growth Rate in Excel, there is a basic formula =((End Value/Start Value)^(1/Periods) -1. And we can easily apply this formula as following:

1. Select a blank cell, for example Cell E3, enter the below formula into it, and press the Enter key. See screenshot:

=(C12/C3)^(1/(10-1))-1

Note: In the above formula, C12 is the cell with end value, C3 is the cell with start value, 10-1 is the period between start value and end value, and you can change them based on your needs.

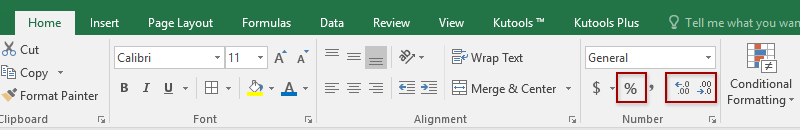
2. In some cases, the calculation result may not format as percentage. Please keep selecting the calculation result, click the Percent Style button  on the Home tab to change the number to percentage format, and then change its decimal places with clicking the Increase Decimal button  or Decrease Decimal button . See screen shot:


Calculate compound annual growth rate with XIRR function in Excel

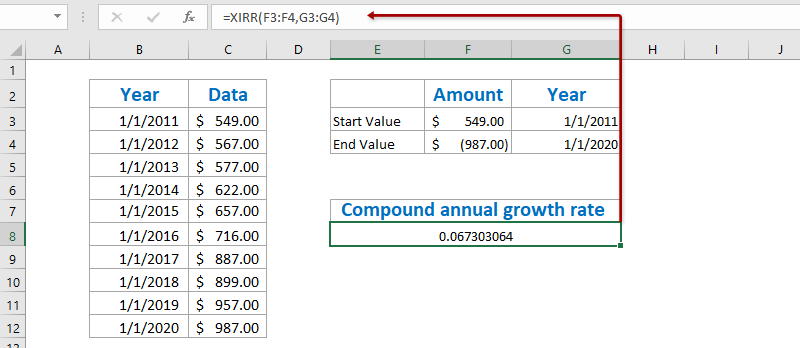
Actually, the XIRR function can help us calculate the Compound Annual Growth Rate in Excel easily, but it requires you to create a new table with the start value and end value.

1. Create a new table with the start value and end value as the following first screen shot shown:

Note: In Cell F3 enter =C3, in Cell G3 enter =B3, in Cell F4 enter =-C12, and in Cell G4 enter =B12, or you can enter your original data into this table directly. By the way, you must add a minus before the End Value.

2. Select a blank cell below this table, enter the below formula into it, and press the Enter key.

=XIRR(F3:F4,G3:G4)

3. For changing the result to percentage format, select the Cell with this XIRR function, click the Percent Style button  on the Home tab, and then change its decimal places with clicking the Increase Decimal button  or Decrease Decimal button . See screen shot:

Quickly save the CAGR table as a mini template, and reuse with only one click in future

It must be very tedious to refer cells and apply formulas for calculating the averages every time. Kutools for Excel provides a cute workaround of AutoText utility to to save the range as an AutoText entry, which can remain the cell formats and formulas in the range. And then you will reuse this range with just one click.

doc cagr autotext


Calculate Average Annual Growth Rate in Excel

To calculate the Average Annual Growth Rate in excel, normally we have to calculate the annual growth rates of every year with the formula = (Ending Value - Beginning Value) / Beginning Value, and then average these annual growth rates. You can do as follows:

1. Besides the original table, enter the below formula into the blank Cell C3 and, and then drag the Fill Handle to the Range C3:C11.

=(C4-C3)/C3

2. Select the Range D4:D12, click the Percent Style button  on the Home tab, and then change its decimal places with clicking the Increase Decimal button  or Decrease Decimal button . See screenshot:

3. Average all annual growth rate with entering below formula into Cell F4, and press the Enter key.

=AVERAGE(D4:D12)

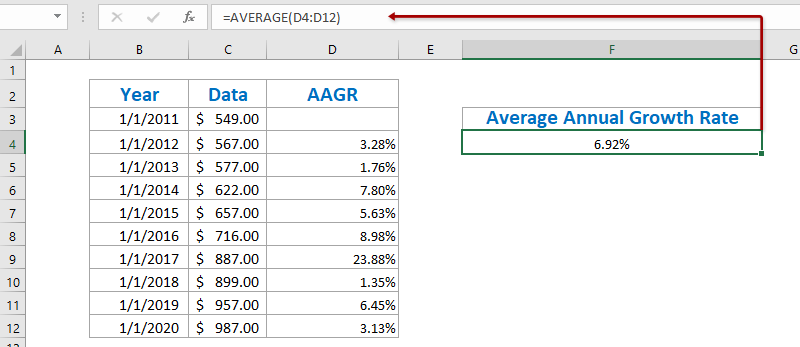
Up to now, Average Annual Growth Rate has been calculated and shown in the Cell C12.


Demo: calculate average/compound annual growth rate in Excel


Kutools for Excel: Over 300 handy tools at your fingertips! Start your 30-day free trial with no feature limitations today. Download Now!

Related articles:

Best Office Productivity Tools

🤖 Kutools AI Aide: Revolutionize data analysis based on: Intelligent Execution   |  Generate Code  |  Create Custom Formulas  |  Analyze Data and Generate Charts  |  Invoke Kutools Functions
Popular Features: Find, Highlight or Identify Duplicates   |  Delete Blank Rows   |  Combine Columns or Cells without Losing Data   |   Round without Formula ...
Super Lookup: Multiple Criteria VLookup    Multiple Value VLookup  |   VLookup Across Multiple Sheets   |   Fuzzy Lookup ....
Advanced Drop-down List: Quickly Create Drop Down List   |  Dependent Drop Down List   |  Multi-select Drop Down List ....
Column Manager: Add a Specific Number of Columns  |  Move Columns  |  Toggle Visibility Status of Hidden Columns  |  Compare Ranges & Columns ...
Featured Features: Grid Focus   |  Design View   |   Big Formula Bar    Workbook & Sheet Manager   |  Resource Library (Auto Text)   |  Date Picker   |  Combine Worksheets   |  Encrypt/Decrypt Cells    Send Emails by List   |  Super Filter   |   Special Filter (filter bold/italic/strikethrough...) ...
Top 15 Toolsets12 Text Tools (Add Text, Remove Characters, ...)   |   50+ Chart Types (Gantt Chart, ...)   |   40+ Practical Formulas (Calculate age based on birthday, ...)   |   19 Insertion Tools (Insert QR Code, Insert Picture from Path, ...)   |   12 Conversion Tools (Numbers to Words, Currency Conversion, ...)   |   7 Merge & Split Tools (Advanced Combine Rows, Split Cells, ...)   |   ... and more

Supercharge Your Excel Skills with Kutools for Excel, and Experience Efficiency Like Never Before. Kutools for Excel Offers Over 300 Advanced Features to Boost Productivity and Save Time.  Click Here to Get The Feature You Need The Most...

Description


Office Tab Brings Tabbed interface to Office, and Make Your Work Much Easier

  • Enable tabbed editing and reading in Word, Excel, PowerPoint, Publisher, Access, Visio and Project.
  • Open and create multiple documents in new tabs of the same window, rather than in new windows.
  • Increases your productivity by 50%, and reduces hundreds of mouse clicks for you every day!
Comments (22)
No ratings yet. Be the first to rate!
This comment was minimized by the moderator on the site
Thank u very much for important scientific information
This comment was minimized by the moderator on the site
How to calculate average of percentage CAGR Return ?
Example :

28.6%

34.9%

25.5%

-2.8%

16.0%
This comment was minimized by the moderator on the site
You can also just use the RATE() formula with setting PMT to 0. RATE(9,0,-549,987) = 6.73%. Built right into Excel already.
This comment was minimized by the moderator on the site
Your period is wrong in CAGR formula ?
This comment was minimized by the moderator on the site
I agree, there's only 9 periods from 1/1/11 to 1/1/20. Ten periods would be 1/1/11 to 12/31/20. Please explain
This comment was minimized by the moderator on the site
Hi - I'm trying to work backwards to find the highest price I can buy a share at when I have a total expected return. Are you able to please help me by reverse engineering the formula to work this out. Using your example - I'm trying to work out what the "3" should be 2.43443 =(3200/x)^(1/(40-8))-1
This comment was minimized by the moderator on the site
Hi,

I have 7 fiscal years of foot traffic data for a retail store:

FY12 FY13 FY14 FY15 FY16 FY17 FY18
2653 2848 2871 2925 2685 2923 3000

My question is: while traffic is increasing, is it increasing at a decreasing rate? Is the growth slowing?


Your first example "(B11/B2)^(1/(10-1))-1" takes the end value and beginning value to get the CAGR. The part I don't understand is that, what about the values in the middle? How does only taking the end and beginning value determine the growth rate accurately? Is there another method where it takes all the fiscal year values into account?
This comment was minimized by the moderator on the site
FY12 - 2653
FY13 - 2848
FY14 - 2871
FY15 - 2925
FY16 - 2685
FY17 - 2923
FY18 - 3000
This comment was minimized by the moderator on the site
Hi Robert,
You can use this formula = (Ending Value - Beginning Value) / Beginning Value to calculate the growth rate of each year, and then compare those growth rates one by one.
This comment was minimized by the moderator on the site
Can someone help with this problem using excel?

The following data show average growth of the human embryo prior to birth.
EMBRYO AGE IN WEEKS WEIGHT IN GRAMS
8 3
12 36
20 330
28 1000
36 2400
40 3200

a). Find the quadratic function of “best fit” for this data. Write this function in standard form: f(x) = ax2 + bx + c.
b). Make a sketch of the scatter plot and the parabola. Plot the quadratic function found above the Y = menu.
c). According to your model, what would a 32-week embryo weigh?
d). According to your model, what week would an embryo weigh 3000 grams?
e). Could the model be used for weight of an embryo for any number of weeks age (such as 100 or 200)? Explain
This comment was minimized by the moderator on the site
Hi Wayne,
You can calculate the Compound Annual Growth Rate with the second method:
=(3200/3)^(1/(40-8))-1
This comment was minimized by the moderator on the site
There is a new tool that will fit to your planning software. MS Excel is a spreadsheet developed by Microsoft for Windows, macOS, Android and iOS. It features calculation, graphing tools, pivot tables, and a macro programming language called Visual Basic for Applications. Thus, it can do Bookkeeping/Accounting, Budgeting (Existing Year and Long Term) and Data Analysis.
This comment was minimized by the moderator on the site
In the CAGR formula, why we are using -1 at the end. I am using two formulaes 1) (I5/I4)^(1/(25-1))-1 2)(I5/I4)^(1/(25)-1) which one is correct..? Please help me out on this thank you.
This comment was minimized by the moderator on the site
The first formula you are using is the correct one!
This comment was minimized by the moderator on the site
The formula is actually CORRECT, but the explanation is incorrect. There are 10 dates that represent 9 periods. It should say that "n-1" means "dates-1", not "periods - 1". You can verify it yourself by increasing each year by this example's n-1 CAGR and you will get the final result.
There are no comments posted here yet
Load More
Please leave your comments in English
Posting as Guest
×
Rate this post:
0   Characters
Suggested Locations