How to extract data from chart or graph in Excel?
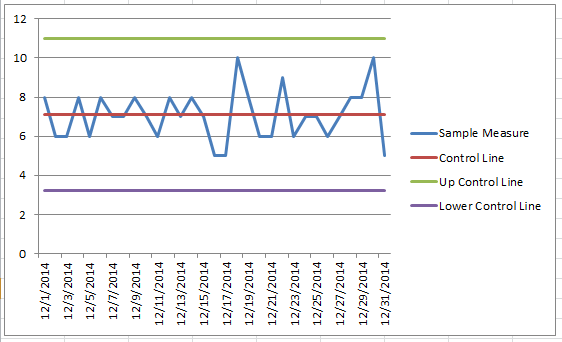
Extract data from chart with VBA
 Extract data from chart with VBA
1. You need to create a new worksheet and rename it as ChartData. See screenshot:

2. Then select the chart you want to extract data from and press Alt + F11 keys simultaneously, and a Microsoft Visual Basic for Applications window pops.
3. Click Insert > Module, then paste below VBA code to the popping Module window.
VBA: Extract data from chart.
Sub GetChartValues()
    'Updateby20220510
    Dim xNum As Integer
    Dim xSeries As Object
    On Error Resume Next
    xCount = 2
    xNum = UBound(Application.ActiveChart.SeriesCollection(1).Values)
    Application.Worksheets("ChartData").Cells(1, 1) = "X Values"
    With Application.Worksheets("ChartData")
        .Range(.Cells(2, 1), _
        .Cells(xNum + 1, 1)) = _
        Application.Transpose(ActiveChart.SeriesCollection(1).XValues)
    End With
    For Each xSeries In Application.ActiveChart.SeriesCollection
        Application.Worksheets("ChartData").Cells(1, xCount) = xSeries.Name
        With Application.Worksheets("ChartData")
            .Range(.Cells(2, xCount), _
            .Cells(xNum + 1, xCount)) = _
            Application.WorksheetFunction.Transpose(xSeries.Values)
        End With
        xCount = xCount + 1
    Next
End Sub
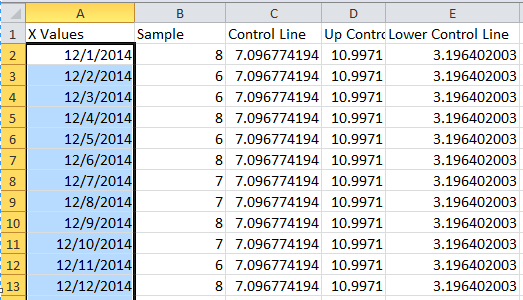
4. Then click Run button to run the VBA. See screenshot:

Then you can see the data is extracted to ChartData sheet.
Tip:
1. You can format the cells as you need.
2. The data of the selected chart is extracted to the first cell of the ChartData sheet in default.
|
Tip: If you usually use complex charts in Excel, which will be troublesome as you create them very time, here with the Auto Text tool of Kutools for Excel, you just need to create the charts at first time, then add the charts in the AutoText pane, then, you can reuse them in anywhere anytime, what you only need to do is change the references to match your real need. Click for free download it now. |

Best Office Productivity Tools
Supercharge Your Excel Skills with Kutools for Excel, and Experience Efficiency Like Never Before. Kutools for Excel Offers Over 300 Advanced Features to Boost Productivity and Save Time. Click Here to Get The Feature You Need The Most...
")
Office Tab Brings Tabbed interface to Office, and Make Your Work Much Easier
- Enable tabbed editing and reading in Word, Excel, PowerPoint, Publisher, Access, Visio and Project.
- Open and create multiple documents in new tabs of the same window, rather than in new windows.
- Increases your productivity by 50%, and reduces hundreds of mouse clicks for you every day!
")