How to average per day/month/quarter/hour with pivot table in Excel?
When working with large datasets that include date and time fields, it’s often necessary to calculate averages for distinct periods—such as per day, month, quarter, or hour—in Excel. Doing this manually for each time segment by filtering and calculating can be very time-consuming and prone to error. This is especially challenging when you have transactional or event-based records stretching across long intervals or multiple categories. Fortunately, Excel offers several solutions to efficiently calculate period-based averages, including pivot tables, dedicated add-ins, built-in formulas, and even automation using macros. Each method has its specific applicable scenarios and advantages depending on your workflow and familiarity with Excel features.
- Average per day/month/quarter/hour with Pivot Table
- Batch calculate daily/weekly/monthly/yearly averages from hourly data with Kutools for Excel
- Average per day/month/quarter/hour with Excel Formula
- Automate average calculations by grouping data with VBA Code
Average per day/month/quarter/hour with Pivot Table
Excel’s Pivot Table feature is a practical tool for summarizing and analyzing data, especially when you need to rapidly calculate averages for discrete time periods such as days, months, quarters, or hours. The approach below avoids manual filtering and repetitive calculations, giving you an interactive summary that’s easy to adjust if your data changes.
1. Select your entire original data table (including headers), and then click the Insert tab > PivotTable.


2. In the appearing Create PivotTable dialog box, choose Existing Worksheet if you want to place your summary in the active worksheet. Set the Location by selecting a cell where you want the Pivot Table to appear, then click OK.
Note: To display the Pivot Table in a new worksheet, select the New Worksheet option instead. Be sure the chosen location does not overlap any existing data to avoid overwrite warnings.
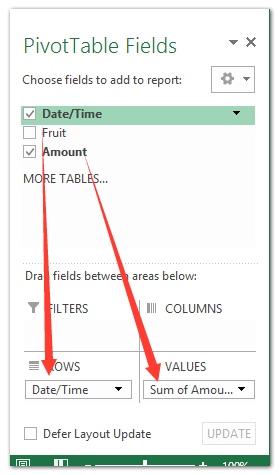
3. In the PivotTable Field List pane (usually appears at the right), drag your Date/Time column into the Rows area, and the Amount (numeric data) column into the Values area. This initial setup aggregates your data by each recorded timestamp.
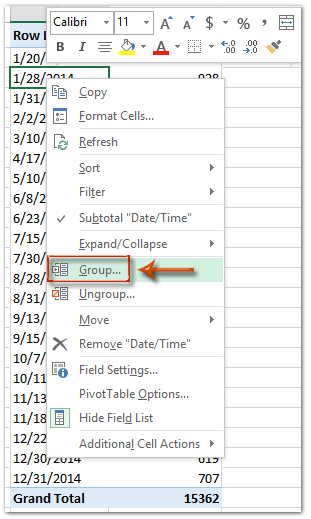
4. To organize your results by specific periods, right-click any date entry in the Pivot Table, and select Group in the context menu. This feature allows you to consolidate data entries into intervals like days, months, quarters, or hours.
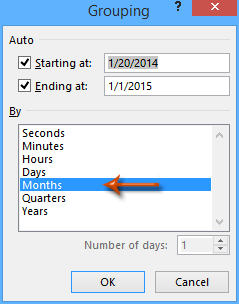
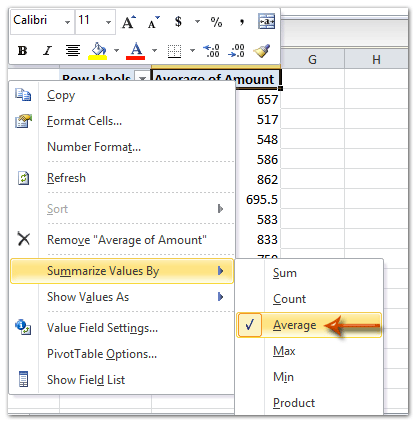
5. In the Grouping dialog box, choose your preferred grouping period by highlighting options in the By field (such as Months). Click OK to apply. Afterwards, right-click the Sum of Amount value, select Summarize Values By > Average. The Pivot Table now displays the average value for each time period group, enabling instant comparison and analysis.
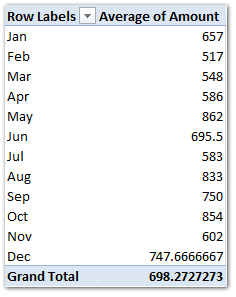
If your period-based average needs to be refreshed with new data, simply refresh the Pivot Table using the Analyze tab > Refresh. In summary, Pivot Tables provide an efficient, visual way to calculate and review averages over defined time intervals, but they may require manual reconfiguration if your grouping structure changes or your data format is inconsistent.
Batch calculate daily/weekly/monthly/yearly averages from hourly data with Kutools for Excel

If you often need to calculate averages for specific periods such as daily, weekly, monthly, or yearly—especially from detailed hourly datasets—the manual grouping and calculation process becomes repetitive and error-prone. Kutools for Excel offers specialized utilities that simplify this process, such as the To Actual and Advanced Combine Rows features, which streamline date formatting and batch aggregation, saving you significant time.
Kutools for Excel - Supercharge Excel with over 300 essential tools, making your work faster and easier, and take advantage of AI features for smarter data processing and productivity. Get It Now
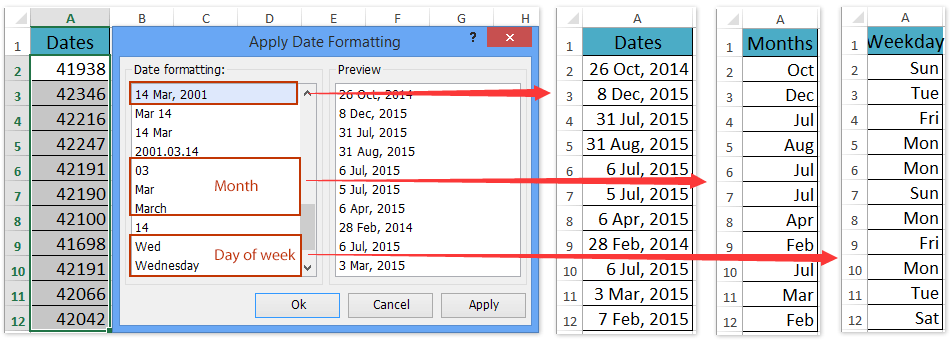
1. Select the cells containing date and time, then format them for your target period. For example, to get daily averages, select your data, navigate to Home > Number Format > Short Date. This converts time stamps to date-only values.
Note: To average by week, month, or year, Kutools for Excel provides Apply Date Formatting and To Actual for converting timestamps into the needed formats with just a few clicks. This ensures consistent grouping and accurate calculation.
2. Highlight your full dataset (including formatted dates and values), then from the Excel ribbon, choose Kutools > Content > Advanced Combine Rows.
3. In the dialog box that opens, pick your Date/Time column in the list, mark it as Primary Key, then select your value column (for example, Amount) and configure it to Calculate > Average. Confirm by clicking OK, and Kutools will immediately calculate averages for each distinct date.
The averages for your specified time periods are instantly computed, streamlining analysis. If your date grouping displays months or years instead of days, results will aggregate accordingly. You can also reformat dates using Kutools > Format > Apply Date Formatting and finalize with Kutools > To Actual.
Kutools for Excel - Supercharge Excel with over 300 essential tools, making your work faster and easier, and take advantage of AI features for smarter data processing and productivity. Get It Now
Average per day/month/quarter/hour with Excel Formula
For users who prefer direct formula calculation without using pivot tables or add-ins, Excel’s built-in functions like AVERAGEIFS, SUMIFS/COUNTIFS offer a flexible, cell-based approach to computing averages for specific periods. This method works well in situations where you need customized calculations, wish to avoid table refreshes, or want results next to your data.
Below is an example of how to use formulas to calculate average values for each day:
1. Suppose your data has dates in column A (A2:A100) and numeric data in column B (B2:B100). In a new column (for example, cell C2), enter the following formula to calculate the average for a specific day (e.g., the date in A2):
=AVERAGEIFS(B$2:B$100, A$2:A$100, A2)2. Press Enter to apply the formula. To calculate for all dates, copy the formula down alongside your data.
Tip: If you want daily averages to appear only once per unique day, first sort or filter your data for unique dates, and then apply the formula accordingly.
Automate average calculations by grouping data with VBA Code
For users who routinely process very large datasets or need to repeat average calculations for different periods, automating your workflow with VBA macros can greatly increase consistency and efficiency. Macros can group and calculate averages for day, month, quarter, or hour, entirely eliminating manual repetition. This approach is well-suited for advanced Excel users and scenarios where calculations need to be rerun frequently or adapted for new sheets.
1. To get started, open the VBA editor by clicking Developer Tools > Visual Basic. When the Microsoft Visual Basic for Applications window appears, click Insert > Module and copy the following code into the module:
Sub AverageByPeriod()
    Dim ws As Worksheet
    Dim dataRange As Range
    Dim periodCol As String, valueCol As String
    Dim dict As Object
    Dim cell As Range
    Dim periodKey As String
    Dim i As Long, lastRow As Long
    Dim sumDict As Object, countDict As Object

    Set ws = ActiveSheet
    periodCol = "A" ' Date/Time column
    valueCol = "B" ' Value column
    lastRow = ws.Cells(ws.Rows.Count, periodCol).End(xlUp).Row

    Set dict = CreateObject("Scripting.Dictionary")
    Set sumDict = CreateObject("Scripting.Dictionary")
    Set countDict = CreateObject("Scripting.Dictionary")

    For i = 2 To lastRow
        ' Grouping by month example; change to format for day/hour/quarter if needed
        periodKey = Format(ws.Cells(i, periodCol).Value, "yyyy-mm")

        If Not dict.Exists(periodKey) Then
            dict.Add periodKey, dict.Count + 1
            sumDict.Add periodKey, ws.Cells(i, valueCol).Value
            countDict.Add periodKey, 1
        Else
            sumDict(periodKey) = sumDict(periodKey) + ws.Cells(i, valueCol).Value
            countDict(periodKey) = countDict(periodKey) + 1
        End If
    Next i

    ws.Cells(1, 4).Value = "Period"
    ws.Cells(1, 5).Value = "Average"

    i = 2
    Dim k As Variant
    For Each k In dict.Keys
        ws.Cells(i, 4).Value = k
        ws.Cells(i, 5).Value = sumDict(k) / countDict(k)
        i = i + 1
    Next k
End Sub2. After pasting the code, click the ![]() button to execute. The macro will read your data (from column A and B, starting row2), group it by your chosen period (currently set to month), and display the average for each group in columns D and E.
button to execute. The macro will read your data (from column A and B, starting row2), group it by your chosen period (currently set to month), and display the average for each group in columns D and E.
Tips:
- To group by day, change the
Format(..., "yyyy-mm-dd")line. - For quarterly grouping, use:
periodKey = "Q" & WorksheetFunction.RoundUp(Month(ws.Cells(i, periodCol).Value) /3,0) & "-" & Year(ws.Cells(i, periodCol).Value) - Always verify your columns (
periodCol,valueCol) match your data layout.
Precautions:
- If you get an error or blank results, check that there are no blank cells or non-date values in your grouping column.
- Adjust column assignment as needed—if your data starts in columns other than A and B, update
periodColandvalueColaccordingly. - Be sure to save your work before running macros to avoid unintended data changes.
Demo: calculate daily/weekly/monthly/yearly averages from hourly data
Related articles:
Best Office Productivity Tools
Supercharge Your Excel Skills with Kutools for Excel, and Experience Efficiency Like Never Before. Kutools for Excel Offers Over 300 Advanced Features to Boost Productivity and Save Time. Click Here to Get The Feature You Need The Most...
Office Tab Brings Tabbed interface to Office, and Make Your Work Much Easier
- Enable tabbed editing and reading in Word, Excel, PowerPoint, Publisher, Access, Visio and Project.
- Open and create multiple documents in new tabs of the same window, rather than in new windows.
- Increases your productivity by 50%, and reduces hundreds of mouse clicks for you every day!
All Kutools add-ins. One installer
Kutools for Office suite bundles add-ins for Excel, Word, Outlook & PowerPoint plus Office Tab Pro, which is ideal for teams working across Office apps.
- All-in-one suite — Excel, Word, Outlook & PowerPoint add-ins + Office Tab Pro
- One installer, one license — set up in minutes (MSI-ready)
- Works better together — streamlined productivity across Office apps
- 30-day full-featured trial — no registration, no credit card
- Best value — save vs buying individual add-in