How to calculate average in a column based on criteria in another column in Excel?
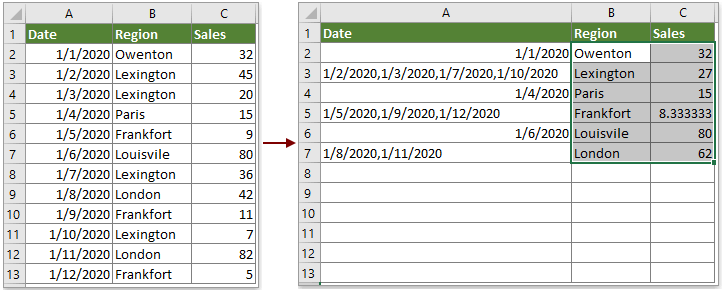
In many practical Excel scenarios, it's often necessary to calculate the average of values in one column, grouped or filtered according to matching entries in another column. For example, you may want to determine the average sales for each salesperson or for each region, as shown in the screenshot below. This type of calculation is commonly used in summary reports, performance analysis, and data reviews. In this article, we will showcase several effective methods to achieve this outcome, ensuring you can select the approach best suited to your needs and skill level.
Calculate average in a column based on same value in another column with formulas
Calculate average in a column based on same value in another column with Kutools for Excel
Calculate average by group using Pivot Table
Automate grouped average calculation with VBA macro
Calculate average in a column based on same value in another column with formulas
One of the most straightforward methods for calculating the average for a group based on another column in Excel is by using conditional formulas, such as AVERAGEIF or AVERAGEIFS. This approach is particularly useful when you want targeted results for specific criteria, such as finding the average sales for a single city or salesperson.
1. Select a blank cell where you want to display the result, then enter the following formula and press Enter:
=AVERAGEIF(B2:B13,E2,C2:C13)

Explanation of parameters: In the above formula, B2:B13 is the range containing the criteria to check (for example, the city or salesperson), E2 is the specific value against which you want to compare (such as "Owenton"), and C2:C13 is the range containing the numeric values you want to calculate the average for.
After pressing Enter, you will immediately get the average for the group specified in E2 (for example, the average sales for "Owenton").
If you need to calculate the average for each unique value in the criteria column, simply modify the value in the criteria cell (E2) accordingly, or copy the formula down if you have a list of unique entries.
Practical tip: For larger data sets or many unique groups, combining this formula with a list of unique values (using tools like "Remove Duplicates" or Excel's UNIQUE function in Office 365 and Excel 2021) can speed up the process of calculating all group averages at once. Double-check that the ranges in your formula cover all the intended data and remain aligned as you copy the formula.
Common errors and troubleshooting:
- If you get a #DIV/0! error, check whether your criteria value actually appears in the selected range.
- Ensure that your numeric range contains only valid numbers; text or blank cells can affect the calculation.
Calculate average in a column based on same value in another column with Kutools for Excel
If you want to automatically calculate the average for all unique values in one column without repeatedly entering formulas or manually filtering, Kutools for Excel provides a streamlined way to perform this task. This is especially beneficial when you are handling large lists or complex datasets.
1. Select the entire range of data that includes both the group column and the numeric column you want to average. Then go to Kutools > Merge & Split > Advanced Combine Rows.

2. In the Combine Rows Based on Column dialog box, proceed as follows:
- Select the column you want to group by (e.g., City or Salesperson), and click the Primary Key button to define it as the grouping field.
- Select the numeric column you wish to average, then click Calculate > Average.
Hint: For any other columns (such as dates), you can specify how to combine their values (for example, join with a comma). - Click OK to process the operation.

Kutools will instantly group the data based on your selected key and return the average for each group in the numeric column.
Kutools' batch processing is ideal for users who regularly analyze grouped statistics, such as monthly reports, departmental summaries, or other multi-group calculations. As an add-in, Kutools does not alter your original data structure, and its preview function lets you review groupings before applying changes.
Note and tips:
- Make sure there are no empty rows in your selected range before running the tool.
- If you need the grouped averages elsewhere, use Copy and Paste to transfer the results after calculation.
- In very large datasets, verify that grouping and numeric columns are correctly assigned to prevent confusion.
Kutools for Excel - Supercharge Excel with over 300 essential tools, making your work faster and easier, and take advantage of AI features for smarter data processing and productivity. Get It Now
Calculate average by group using Pivot Table
Pivot Tables offer a powerful, built-in way to summarize, group, and analyze data—including calculating averages by group—without needing formulas or third-party add-ins. This technique is ideal when you want an interactive view of averages and totals by different categories, and it's suitable for both small and very large datasets.
How to configure a Pivot Table to calculate group averages:
- Select any cell in your dataset, then go to Insert > PivotTable. In the dialog, choose where you want the Pivot Table to appear (new or existing worksheet) and click OK.
- In the PivotTable Fields pane, drag the column you want to group by into the Rows area (for example, "City" or "Salesperson").
- Drag the numeric column you want to average (such as "Sales") into the Values area. By default, Excel may calculate the sum; to change this, click on the value field, select Value Field Settings, and choose Average.
Your Pivot Table will instantly display the average value by each group. You can quickly filter, sort, and format the report as needed. This method is user-friendly and avoids the risk of formula errors.
Advantages: Interactive, handles large data volumes elegantly, can summarize multiple statistics together.
Drawbacks: Result is shown in a Pivot Table format, not a simple list; requires occasional refresh if source data changes.
Tip: Double-clicking on any summary cell in the Pivot Table opens a new worksheet with the underlying data for that group, making it easy to audit details or troubleshoot discrepancies.
Common issues:
- If you cannot get the average, confirm that the value field is set to "Average" in Value Field Settings.
- Check your source data for extra blank rows or columns that can cause layout issues in the Pivot Table.
Automate grouped average calculation with VBA macro
For users who frequently need to calculate averages for many groups or wish to produce a summary automatically, writing a VBA macro can save significant manual effort. VBA is especially helpful when you expect your data structure to remain consistent or want to generate repeated summary reports at the click of a button.
Before you begin, make sure to save your workbook and enable macros. Here's how to get started:
1. Click Developer Tools > Visual Basic to open the VBA editor. In the editor, click Insert > Module to create a new code module. Paste the code below into the module:
Sub GroupAverageSummary()
    Dim srcSheet As Worksheet
    Dim dstSheet As Worksheet
    Dim dict As Object
    Dim groupCol As Range, valueCol As Range
    Dim lastRow As Long
    Dim i As Long
    Dim groupKey As Variant
    Dim sumArr As Object, countArr As Object

    On Error Resume Next
    xTitleId = "KutoolsforExcel"

    Set srcSheet = ActiveSheet
    Set dict = CreateObject("Scripting.Dictionary")

    ' Prompt user to select group (criteria) column
    Set groupCol = Application.InputBox("Select the group (criteria) column:", xTitleId, Type:=8)
    If groupCol Is Nothing Then Exit Sub

    ' Prompt user to select value column
    Set valueCol = Application.InputBox("Select the value column to average:", xTitleId, Type:=8)
    If valueCol Is Nothing Then Exit Sub

    Set sumArr = CreateObject("Scripting.Dictionary")
    Set countArr = CreateObject("Scripting.Dictionary")

    For i = 1 To groupCol.Rows.Count
        groupKey = groupCol.Cells(i, 1).Value
        If groupKey <> "" And IsNumeric(valueCol.Cells(i, 1).Value) Then
            If Not dict.Exists(groupKey) Then
                dict.Add groupKey, 0
                sumArr.Add groupKey, 0
                countArr.Add groupKey, 0
            End If
            sumArr(groupKey) = sumArr(groupKey) + valueCol.Cells(i, 1).Value
            countArr(groupKey) = countArr(groupKey) + 1
        End If
    Next

    ' Output result to a new worksheet
    Set dstSheet = Worksheets.Add
    dstSheet.Name = "Group Average Summary"
    dstSheet.Cells(1, 1).Value = "Group"
    dstSheet.Cells(1, 2).Value = "Average"

    i = 2
    For Each groupKey In dict.Keys
        dstSheet.Cells(i, 1).Value = groupKey
        dstSheet.Cells(i, 2).Value = sumArr(groupKey) / countArr(groupKey)
        i = i + 1
    Next
End Sub
2. After inserting the code, close the VBA editor. Return to Excel, press Alt+F8, select GroupAverageSummary in the list, and click Run. The macro will prompt you to select your group (criteria) column and the value (numeric) column. Once you've made selections, it will automatically generate a new worksheet named "Group Average Summary" showing each unique group and their corresponding average values.
Parameter and operation notes:
- Ensure your group and value columns are of the same length and contain valid data (i.e., avoid partial selections).
- This macro can be modified for more advanced groupings or additional summary statistics as needed.
- If your sheet already includes a worksheet named "Group Average Summary", the macro will create a worksheet with the default worksheet name.
Troubleshooting:
- If you encounter a "subscript out of range" or similar message, verify your selection ranges align correctly and are on the same worksheet.
- For best results, make sure the value column contains only numeric data—text or blank cells within the numeric range will be skipped by the macro.
Using this macro is ideal for batch processing, automated reports, or situations where you frequently need to summarize new or updated data sets.
Demo: Calculate average in a column based on same value in another column with Kutools for Excel
Best Office Productivity Tools
Supercharge Your Excel Skills with Kutools for Excel, and Experience Efficiency Like Never Before. Kutools for Excel Offers Over 300 Advanced Features to Boost Productivity and Save Time. Click Here to Get The Feature You Need The Most...
Office Tab Brings Tabbed interface to Office, and Make Your Work Much Easier
- Enable tabbed editing and reading in Word, Excel, PowerPoint, Publisher, Access, Visio and Project.
- Open and create multiple documents in new tabs of the same window, rather than in new windows.
- Increases your productivity by 50%, and reduces hundreds of mouse clicks for you every day!
All Kutools add-ins. One installer
Kutools for Office suite bundles add-ins for Excel, Word, Outlook & PowerPoint plus Office Tab Pro, which is ideal for teams working across Office apps.
- All-in-one suite — Excel, Word, Outlook & PowerPoint add-ins + Office Tab Pro
- One installer, one license — set up in minutes (MSI-ready)
- Works better together — streamlined productivity across Office apps
- 30-day full-featured trial — no registration, no credit card
- Best value — save vs buying individual add-in