How to quickly condense rows based on same value in Excel?
Condense rows based on value with PivotTable
Condense rows based on value with Kutools for Excel
Condense rows based on value with formulas
Condense and sum rows with a VBA macro
Condense rows based on value with PivotTable
Excel's PivotTable feature is designed to quickly and efficiently summarize data, especially when you need to condense rows based on duplicate values in one column and aggregate numerical data in another. This is ideal for users who want an interactive summary table with options to further group, filter, and analyze results. PivotTables excel in handling large data sets and updating with minimal effort.
1. Select the complete range of your data, including the column headers, and go to the Insert tab at the top ribbon. Then, click PivotTable. The "Create PivotTable" dialog box will appear—choose whether to place the PivotTable in a New Worksheet or an Existing Worksheet as needed for your workflow, and then click OK. See screenshot:
2. In the "PivotTable Fields" pane, drag the Order field to the Rows area and the Sales field to the Values area. This automatically generates a summary table with each unique order and the corresponding sum of sales.
Tip: By default, PivotTable will sum your numerical column. If you want a different calculation, such as Average, Count, Min, or Max, click the drop-down arrow next to "Sum of Sales" in the "Values" section, select Value Field Settings, and choose the appropriate operation. 
Pros:
- Ideal for dynamic analysis and data exploration.
- Easily updates if your source data changes.
- Offers rich options for further filtering, grouping, and layout adjustments.
- Requires familiarity with PivotTable controls for advanced customization.
Condense rows based on value with Kutools for Excel
"Kutools for Excel" provides a streamlined method to combine duplicate rows and summarize your data, making it especially useful for repetitive or extensive tasks. This tool is well-suited for users managing large amounts of data who need to transform or summarize information without complex manual work.
1. Highlight the data range that you wish to condense. Next, go to Kutools on the toolbar, then select Merge & Split > Advanced Combine Rows.
2. The "Advanced Combine Rows" dialog will appear. You will need to:
- Click the header of the column that contains duplicate entries and set it as the Primary Key. This marks which values Excel should use to group data.
- Click the header of the column with numeric values that you want to aggregate. In the Operation drop-down list, choose an appropriate calculation under the "Calculate" section—such as Sum, Average, Max, or Min—based on your needs.
- After you've specified these settings, click OK to process the merge.


3. The rows will be condensed and the specified calculation applied to the selected column.
Practical tips:
- If your dataset contains blank cells or non-numeric text, verify that the calculation column only contains numbers to avoid unexpected results.
- Using Kutools is especially recommended for large datasets that would be cumbersome to merge manually.
- Extremely quick and easy for batch processing.
- Can fully customize how duplicates are merged and which columns are aggregated.
- Requires Kutools for Excel add-in to be installed.
- Modifies your original data range (undo with Ctrl+Z if not saved).
Kutools for Excel - Supercharge Excel with over 300 essential tools, making your work faster and easier, and take advantage of AI features for smarter data processing and productivity. Get It Now
Condense rows based on value with formulas
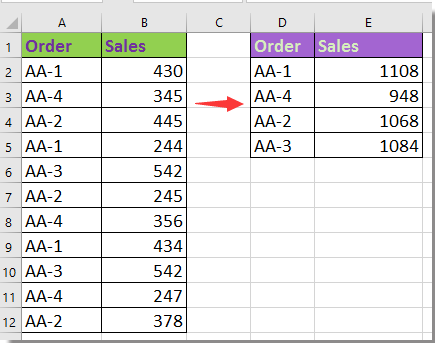
Excel formulas offer a flexible way to summarize data without restructuring your worksheet. This method is suitable for customized tasks, smaller data sets, or when you want to condense information in a separate area, leaving the source intact. Popular formulas such as SUMIF can automatically calculate totals for each unique value.
1. Choose a blank cell next to your data range—for example, cell D2—and enter the following formula. Press Shift + Ctrl + Enter keys to calculate for the first unique value.
=INDEX($A$2:$A$12,MATCH(0,COUNTIF($D$1:D1,$A$2:$A$12),0))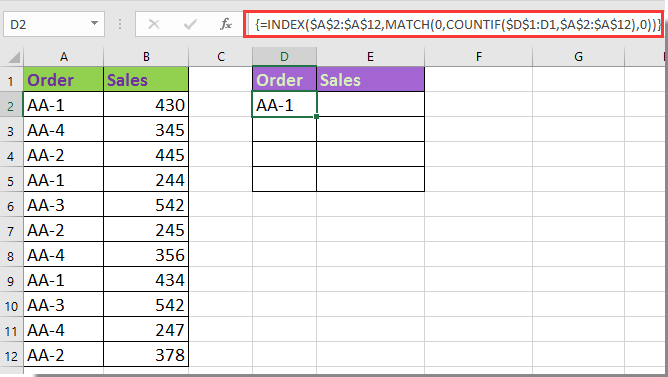
Note: Adjust the ranges in the formula—"A2:A12" refers to the list containing possible duplicates, and "D1" is the starting cell for your results. Make sure cell references match your actual worksheet, and use absolute references if you plan to copy formulas to other cells.
2. Select cell D2 (where you entered the formula) and drag the autofill handle down until you reach the end of your list, or until an error value appears, indicating all unique entries have been listed.
3. Delete any error values that appear at the end of your list. Next, move to the neighboring cell in the results area (e.g., E2), input the following formula to sum values for each entry, press Enter, and fill down to apply it to other rows.
=SUMIF($A$2:$A$12,D2,$B$2:$B$12)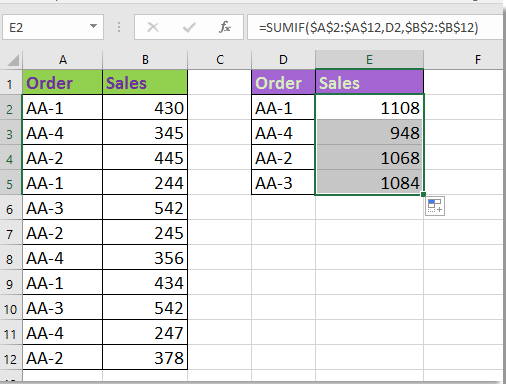
Note: "A2:A12" is the source column you want to check for duplicates, "D2" is the cell containing the first unique value, and "B2:B12" is the column containing the sales or numeric values. Adjust these references as necessary for your data set.
Tips and precautions:
- Formulas do not alter the original data and are especially suitable for side-by-side summary reports.
- If desired, you can use other aggregation functions—like COUNTIF, AVERAGEIF, etc.—to suit your analysis needs.
Condense and sum rows with a VBA macro
When working with especially large datasets or when you need to repeatedly condense rows based on identical values, automating the process with a VBA macro can save significant time and effort. This approach allows you to batch process hundreds or thousands of rows, or add the functionality to a custom workflow. The VBA solution provided here will sum values in a specified column for each unique item in another column, then output condensed results to a new worksheet, preserving your original data.
1. Open Excel and press Alt+F11 to enter the Visual Basic for Applications editor. In the VBA editor, click Insert > Module to create a new code module. Copy and paste the following code into the module window:
Sub CondenseAndSumRows()
    Dim srcWS As Worksheet, destWS As Worksheet
    Dim lastRow As Long, i As Long
    Dim dict As Object
    Dim keyCol As String, sumCol As String
    Dim dataRange As Range, cell As Range

    On Error Resume Next
    Set dict = CreateObject("Scripting.Dictionary")

    Set srcWS = Application.ActiveSheet

    ' Prompt to select the whole data range
    Set dataRange = Application.InputBox("Select full data range including headers", "KutoolsforExcel", Type:=8)

    keyCol = Application.InputBox("Select header name for key/duplicate column", "KutoolsforExcel", Type:=2)
    sumCol = Application.InputBox("Select header name for numeric/sum column", "KutoolsforExcel", Type:=2)

    If dataRange Is Nothing Or keyCol = "" Or sumCol = "" Then Exit Sub

    ' Get column numbers by header
    Dim keyColNum As Integer, sumColNum As Integer
    For i = 1 To dataRange.Columns.Count
        If dataRange.Cells(1, i).Value = keyCol Then
            keyColNum = i
        End If
        If dataRange.Cells(1, i).Value = sumCol Then
            sumColNum = i
        End If
    Next i

    If keyColNum = 0 Or sumColNum = 0 Then
        MsgBox "Column headers not found. Check header spelling!", vbExclamation
        Exit Sub
    End If

    ' Summing values for each key
    For i = 2 To dataRange.Rows.Count
        If Not IsNumeric(dataRange.Cells(i, sumColNum).Value) Then
            ' Ignore non-numeric, prevent errors
            GoTo SkipRow
        End If

        If dict.Exists(dataRange.Cells(i, keyColNum).Value) Then
            dict(dataRange.Cells(i, keyColNum).Value) = dict(dataRange.Cells(i, keyColNum).Value) + dataRange.Cells(i, sumColNum).Value
        Else
            dict(dataRange.Cells(i, keyColNum).Value) = dataRange.Cells(i, sumColNum).Value
        End If
SkipRow:
    Next i

    ' Output results to new worksheet
    Set destWS = Worksheets.Add
    destWS.Name = "Condensed Summary"

    destWS.Cells(1, 1).Value = keyCol
    destWS.Cells(1, 2).Value = "Total " & sumCol

    i = 2
    Dim k
    For Each k In dict.Keys
        destWS.Cells(i, 1).Value = k
        destWS.Cells(i, 2).Value = dict(k)
        i = i + 1
    Next k

    MsgBox "Condensing complete! Check the worksheet 'Condensed Summary'.", vbInformation
End Sub
2. Next, run the macro by clicking the ![]() button or pressing F5 while the module is selected. A dialog box will prompt you to select the full range of your data (including headers), then select the column headers for your key (duplicate) column and numeric (sum) column. Follow the prompts to continue—the macro will automatically calculate totals by unique value and write the results to a new worksheet named "Condensed Summary". This keeps your original sheet unchanged for safety.
button or pressing F5 while the module is selected. A dialog box will prompt you to select the full range of your data (including headers), then select the column headers for your key (duplicate) column and numeric (sum) column. Follow the prompts to continue—the macro will automatically calculate totals by unique value and write the results to a new worksheet named "Condensed Summary". This keeps your original sheet unchanged for safety.
Troubleshooting:
- If you get a "Column headers not found" error, ensure headers entered exactly match those in the data sheet (case-sensitive).
- If no summary is created, verify the selected range includes both headers and data, and there is at least one numeric value in the aggregation column.
Pros:
- Can be reused and adapted for new data sets.
- Fast for very large files, and does not require external add-ins.
- Can be extended to combine other fields or automate other calculations in future.
Summary
When you need to merge or analyze rows in Excel based on shared values, choosing the right approach depends on your goals and workbook structure:
- PivotTables are optimal for interactive analysis and quick summaries, especially in evolving data environments.
- Kutools for Excel offers intuitive and customized merging features, ideal for users handling repeated tasks without scripting.
- Formulas provide the most flexibility, are easy to audit, and work well for static reports or custom logic.
- VBA macros are efficient for automating large or repetitive batch operations and producing new condensed reports without manual labor.
Best Office Productivity Tools
Supercharge Your Excel Skills with Kutools for Excel, and Experience Efficiency Like Never Before. Kutools for Excel Offers Over 300 Advanced Features to Boost Productivity and Save Time. Click Here to Get The Feature You Need The Most...
Office Tab Brings Tabbed interface to Office, and Make Your Work Much Easier
- Enable tabbed editing and reading in Word, Excel, PowerPoint, Publisher, Access, Visio and Project.
- Open and create multiple documents in new tabs of the same window, rather than in new windows.
- Increases your productivity by 50%, and reduces hundreds of mouse clicks for you every day!
All Kutools add-ins. One installer
Kutools for Office suite bundles add-ins for Excel, Word, Outlook & PowerPoint plus Office Tab Pro, which is ideal for teams working across Office apps.
- All-in-one suite — Excel, Word, Outlook & PowerPoint add-ins + Office Tab Pro
- One installer, one license — set up in minutes (MSI-ready)
- Works better together — streamlined productivity across Office apps
- 30-day full-featured trial — no registration, no credit card
- Best value — save vs buying individual add-in