How to quickly and easily create a panel chart in Excel?
The panel chart can show two or more similar sets of data, side-by-side as below screenshot shown. But in general, to create a panel chart is difficult and complicated, and in this article, I will introduce the trick on quickly and easily creating a panel chart in Excel.
Create a panel chart with several clicks
 Create a panel chart quickly
Please follow below tutorial to create a panel chart step by step.
1. Select first set of data, and then click Insert tab and select a chart to create a chart. See screenshot:
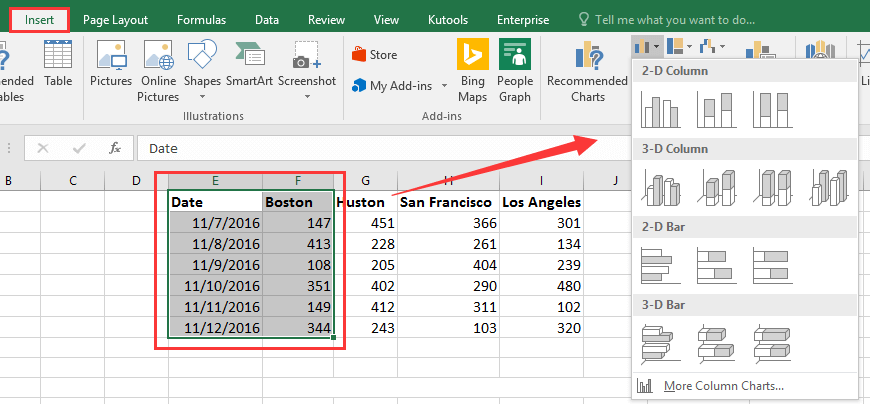 |
 |
2. Then create the second, third and fourth charts by other sets of data one by one as below step doing. See screenshot:


3. Then hold Ctrl key to select all charts, and drag mouse to resize them together. See screenshot:
 |
 |
4. And now place them side by side as you need. See screenshot:
5. Hold Ctrl key to select all charts again, and click Format > Group > Group to make these charts as one group. See screenshot:
6. Now the four charts are in a group, and you can you can move and resize it as you need.
Create a panel chart with several clicks
Kutools for Excel’s Multi Layer Column Chart feature creates a chart that places two or more sets of data row by row as below screenshot shown, which only need 2 steps.
Kutools for Excel’s Charts group contains dozens of smart charts which all only need to clicks to create.
1. Select the data including headers, then click Kutools > Charts > Category Comparison > Multi Layer Column Chart.
2. In the popping dialog, choose one style you want the chart show, and tick Show data labels checkbox if you want the data labels show in the result chart. Click Ok.
Best Office Productivity Tools
Supercharge Your Excel Skills with Kutools for Excel, and Experience Efficiency Like Never Before. Kutools for Excel Offers Over 300 Advanced Features to Boost Productivity and Save Time. Click Here to Get The Feature You Need The Most...
")
Office Tab Brings Tabbed interface to Office, and Make Your Work Much Easier
- Enable tabbed editing and reading in Word, Excel, PowerPoint, Publisher, Access, Visio and Project.
- Open and create multiple documents in new tabs of the same window, rather than in new windows.
- Increases your productivity by 50%, and reduces hundreds of mouse clicks for you every day!
")