How to sort by sum in Pivot Table in Excel?
For example there is a table about monthly sales of goods in the worksheet as below screenshot shown, you want to create a pivot table based on this table and sort these goods by sum of sales in the pivot table, how could you handle this problem? This article will show you the detailed solutions.

Sort by sum in Pivot Table vertically
This method will guide you to create a pivot table based on given table, and then sort items by the sum in the pivot table vertically (from top to bottom) easily.
1. Select the source data you will create a pivot table based on, and click Insert > PivotTable. See screenshot:
2. In the Create PivotTable dialog box, please specify a destination range to place the pivot table, and click the OK button.
Note: In my case, I select Existing Worksheet option, select the first cell of the destination range, and then click the OK button. See screenshot:
3. In the PivotTable Fields pane, please drag Items and drop to the Rows section, and drag Jan, Feb, and Mar and drop to the Values section. See screenshot:
Now the Pivot table is created, but there is no summary column for us to sort. Therefore, I will add a calculated field to show the summary of each item.
4. Select any cell in the pivot table to enable the PivotTable Tools, and click Analyze (or Options) > Fields, Items, & Sets > Calculated Field. See screenshot:
5. In the Insert Calculated Fields dialog box, please (1) name the calculated filed in the Name box, (2) type = Jan + Feb + Mar (please change the formula based on your fields) in the formula box, and then (3) click the OK button. See screenshot:
6. Now the summary column is added in the pivot table. Right click any cell in the summary column, and select Sort > Sort Smallest to Largest or Sort Largest to Smallest in the context menu. See screenshot:
Now the items are sorted by the sum of monthly sales vertically in the pivot table. See screenshot:

Unlock Excel Magic with Kutools AI
- Smart Execution: Perform cell operations, analyze data, and create charts—all driven by simple commands.
- Custom Formulas: Generate tailored formulas to streamline your workflows.
- VBA Coding: Write and implement VBA code effortlessly.
- Formula Interpretation: Understand complex formulas with ease.
- Text Translation: Break language barriers within your spreadsheets.
Sort by sum in Pivot Table horizontally
If you need to sort total sale amounts of three months in the pivot table horizontally, please do as follows:
1. Please follow Step 1- 3 of above method to create the pivot table.
You will see the total sale amount of each month is added to the Grand Total row of the pivot table.
2. Right-click any cell in the Grand Total row, and select Sort > More Sort Options in the context menu. See screenshot: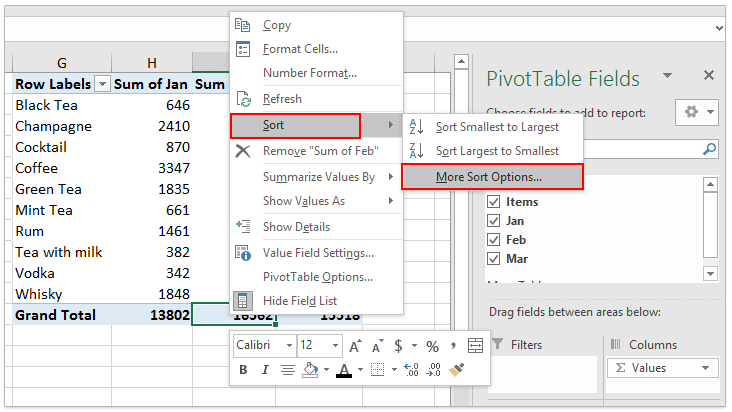
3. In the Sort by Value dialog box, please (1) check a sort option in the Sort options section as you need, (2) check Left to Right option in the Sort direction section, and then (3) click the OK button. See screenshot:
Now you will see the total sale amounts are sorted from left to right. See screenshot:
Related articles:
Best Office Productivity Tools
Supercharge Your Excel Skills with Kutools for Excel, and Experience Efficiency Like Never Before. Kutools for Excel Offers Over 300 Advanced Features to Boost Productivity and Save Time. Click Here to Get The Feature You Need The Most...
Office Tab Brings Tabbed interface to Office, and Make Your Work Much Easier
- Enable tabbed editing and reading in Word, Excel, PowerPoint, Publisher, Access, Visio and Project.
- Open and create multiple documents in new tabs of the same window, rather than in new windows.
- Increases your productivity by 50%, and reduces hundreds of mouse clicks for you every day!
All Kutools add-ins. One installer
Kutools for Office suite bundles add-ins for Excel, Word, Outlook & PowerPoint plus Office Tab Pro, which is ideal for teams working across Office apps.
- All-in-one suite — Excel, Word, Outlook & PowerPoint add-ins + Office Tab Pro
- One installer, one license — set up in minutes (MSI-ready)
- Works better together — streamlined productivity across Office apps
- 30-day full-featured trial — no registration, no credit card
- Best value — save vs buying individual add-in