How to calculate rate of return on a share of stock in Excel?
Let’s say you purchased a share of stock, got dividends in paste several years, and then sold the stock. Now you want to calculate the rate of return on this share of stock, how could you solve it? The XIRR function can figure it out easily.
Calculate rate of return for a share of stock in Excel
Calculate rate of return for a share of stock in Excel
For example, you purchased the stock on 2015/5/10 at $15.60, sold it on 2017/10/13 at $25.30, and get dividends every year as below screenshot shown. Now I will guide you to calculate the rate of return on the stock easily by the XIRR function in Excel.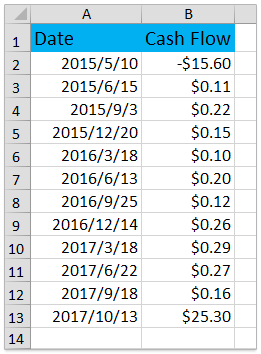
1. Select the cell you will place the calculation result, and type the formula =XIRR(B2:B13,A2:A13), and press the Enter key. See screenshot: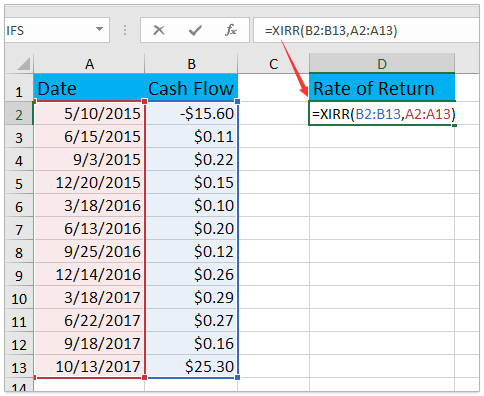
Note: In the formula =XIRR(B2:B13,A2:A13), B2:B13 is the Cash Flow column recording the money you paid and got, and the A2:A13 is the Date column.
2. Keep the calculation result selected, and click the Percent Style button on the Home tab, and click the Increase Decimal or Decrease Decimal buttons to change decimal places of the percentage. See screenshot: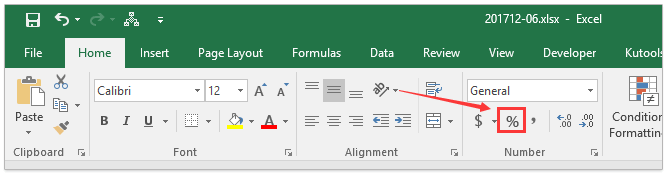
Now the rate of return for the stock is figured out and shown as a percentage. See screenshot: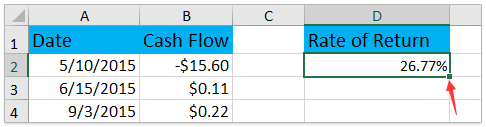

Unlock Excel Magic with Kutools AI
- Smart Execution: Perform cell operations, analyze data, and create charts—all driven by simple commands.
- Custom Formulas: Generate tailored formulas to streamline your workflows.
- VBA Coding: Write and implement VBA code effortlessly.
- Formula Interpretation: Understand complex formulas with ease.
- Text Translation: Break language barriers within your spreadsheets.
Related articles:
Best Office Productivity Tools
Supercharge Your Excel Skills with Kutools for Excel, and Experience Efficiency Like Never Before. Kutools for Excel Offers Over 300 Advanced Features to Boost Productivity and Save Time. Click Here to Get The Feature You Need The Most...
Office Tab Brings Tabbed interface to Office, and Make Your Work Much Easier
- Enable tabbed editing and reading in Word, Excel, PowerPoint, Publisher, Access, Visio and Project.
- Open and create multiple documents in new tabs of the same window, rather than in new windows.
- Increases your productivity by 50%, and reduces hundreds of mouse clicks for you every day!
All Kutools add-ins. One installer
Kutools for Office suite bundles add-ins for Excel, Word, Outlook & PowerPoint plus Office Tab Pro, which is ideal for teams working across Office apps.
- All-in-one suite — Excel, Word, Outlook & PowerPoint add-ins + Office Tab Pro
- One installer, one license — set up in minutes (MSI-ready)
- Works better together — streamlined productivity across Office apps
- 30-day full-featured trial — no registration, no credit card
- Best value — save vs buying individual add-in