How to make a pictograph (chart with pictures) in Excel?
Normally, when creating a graph in Excel, you can use pictures to represent objects instead of bars or lines to make the graph more understandable. This tutorial provides a step-by-step guide for you to easily create a pictograph in Excel.
Make a pictograph in Excel
More tutorial for charts…
Make a pictograph in Excel
Please do as follows to make a pictograph in Excel.
1. Before creating the pictograph, you need to save corresponding pictures to represent the objects in your computer.

2. Select the data range you will create graph by, go to the Insert tab, and then click Insert Column or Bar Chart > Clustered Column. See screenshot:

3. Select a data bar in the chart (here I select the Apple series), right click it and select Format Data Series from the right-clicking menu.

4. In the Format Data Series pane, you need to configure as follows.
- 4.1 Go to the Fill & Line tab;
- 4.2 Expand the Fill section, choose the Picture or texture fill option;
- 4.3 Click the Insert button. See screenshot:

5. In the Insert Pictures dialog, click From a File.

6. In the following Insert Picture window, find and select the corresponding picture you have saved in step 1 and then click the Insert button.

7. Click to select the Stack and Scalewith option in the Format Data Series pane.

Now the specified data series is filled with corresponding pictures as the below screenshot shown.
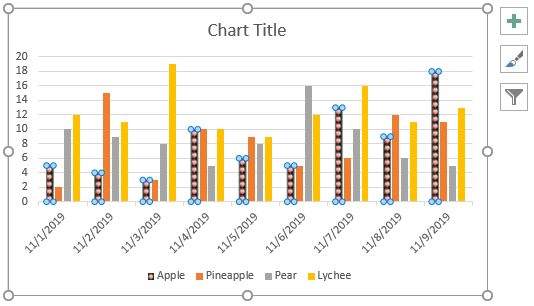
8. Repeat the above step 3 to 7 until all data series are represented by pictures. And then, you will get the result as you need, see screenshot:

Relative Articles:
Quickly create a bubble chart in Excel
In Excel, a Bubble chart is a variation of a Scatter chart and its data is pointed as bubble. And if your each series has three data, creating a Bubble chart will be a good choice to show the data series vividly. This tutorial provides methods to help you create a bubble chart in Excel.
Create dynamic interactive charts in Excel
This article introduces two types of interactive charts: Interactive charts using Drop down menu and Interactive charts using Option buttons.
Create a bell curve chart template in Excel
Bell curve chart, named as normal probability distributions in Statistics, is usually made to show the probable events, and the top of the bell curve indicates the most probable event. This article guides you to create a bell curve chart with your own data, and save the workbook as a template in Excel.
Create funnel chart in Excel
Have you ever wanted to create a funnel chart to show the data ascending or descending in Excel? In Excel, there is no a direct way to create a funnel chart, but this tutorial will show you a circuitous method to create a funnel chart in Excel.
Create speedometer/gauge chart in Excel
Have you ever tried to create a speedometer chart in Excel? This tutorial provides two methods to help you creating speedometer chart in Excel.
Best Office Productivity Tools
Supercharge Your Excel Skills with Kutools for Excel, and Experience Efficiency Like Never Before. Kutools for Excel Offers Over 300 Advanced Features to Boost Productivity and Save Time. Click Here to Get The Feature You Need The Most...
Office Tab Brings Tabbed interface to Office, and Make Your Work Much Easier
- Enable tabbed editing and reading in Word, Excel, PowerPoint, Publisher, Access, Visio and Project.
- Open and create multiple documents in new tabs of the same window, rather than in new windows.
- Increases your productivity by 50%, and reduces hundreds of mouse clicks for you every day!
All Kutools add-ins. One installer
Kutools for Office suite bundles add-ins for Excel, Word, Outlook & PowerPoint plus Office Tab Pro, which is ideal for teams working across Office apps.
- All-in-one suite — Excel, Word, Outlook & PowerPoint add-ins + Office Tab Pro
- One installer, one license — set up in minutes (MSI-ready)
- Works better together — streamlined productivity across Office apps
- 30-day full-featured trial — no registration, no credit card
- Best value — save vs buying individual add-in