How to create a dynamic chart title in Excel?
If you want to create a dynamic chart title in Excel, the method in this article will do you a favor.
Create a dynamic chart title by linking it to a cell
More tutorial for charts…
Create a dynamic chart title by linking it to a cell
Link the chart title to a specific cell will make the title dynamically changed when the cell content changes. Please do as follows.
- 1. Select the chart title;
- 2. Type in an equal mark = into the Formula Bar;
- 3. Click a cell for linking the chart title to it;
- 4. Press the Enter key.

From now on, when changing the content of this cell, the chart title will be updated automatically to show the cell content.

Note: If you want to create dynamic chart title by combining cell link and specific text, please do as follows.
- 1. Select a cell to output the combined cell link and specific text (here I select cell C7);
- 2. Enter the below formula into the Formula Bar and press the Enter key;
- ="Specific text & "&C3
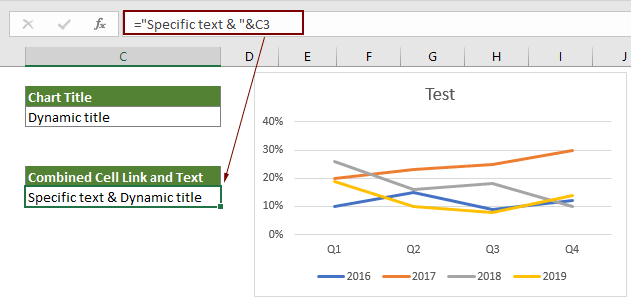
- 3. Select the chart title, enter an equal mark = into the Formula Bar, then click to select the cell containing the combined cell link and text, and then press the Enter key. Then a dynamic chart title by combining cell link and specific text is created as below demo shown.

Relative Articles:
Quickly create a bubble chart in Excel
In Excel, a Bubble chart is a variation of a Scatter chart and its data is pointed as bubble. And if your each series has three data, creating a Bubble chart will be a good choice to show the data series vividly. This tutorial provides methods to help you create a bubble chart in Excel.
Create dynamic interactive charts in Excel
This article introduces two types of interactive charts: Interactive charts using Drop down menu and Interactive charts using Option buttons.
Create a bell curve chart template in Excel
Bell curve chart, named as normal probability distributions in Statistics, is usually made to show the probable events, and the top of the bell curve indicates the most probable event. This article guides you to create a bell curve chart with your own data, and save the workbook as a template in Excel.
Create funnel chart in Excel
Have you ever wanted to create a funnel chart to show the data ascending or descending in Excel? In Excel, there is no a direct way to create a funnel chart, but this tutorial will show you a circuitous method to create a funnel chart in Excel.
Best Office Productivity Tools
Supercharge Your Excel Skills with Kutools for Excel, and Experience Efficiency Like Never Before. Kutools for Excel Offers Over 300 Advanced Features to Boost Productivity and Save Time. Click Here to Get The Feature You Need The Most...
Office Tab Brings Tabbed interface to Office, and Make Your Work Much Easier
- Enable tabbed editing and reading in Word, Excel, PowerPoint, Publisher, Access, Visio and Project.
- Open and create multiple documents in new tabs of the same window, rather than in new windows.
- Increases your productivity by 50%, and reduces hundreds of mouse clicks for you every day!
All Kutools add-ins. One installer
Kutools for Office suite bundles add-ins for Excel, Word, Outlook & PowerPoint plus Office Tab Pro, which is ideal for teams working across Office apps.
- All-in-one suite — Excel, Word, Outlook & PowerPoint add-ins + Office Tab Pro
- One installer, one license — set up in minutes (MSI-ready)
- Works better together — streamlined productivity across Office apps
- 30-day full-featured trial — no registration, no credit card
- Best value — save vs buying individual add-in