Excel: Display cell value in a graph object (shape, textbox, picture, chart)
In Excel, you may want to display the contents of a cell in various graph objects, such as shapes, text boxes, chart titles, or even pictures. This tutorial will guide you through the steps to link a cell's value to these objects, allowing you to create dynamic displays that update automatically when the cell content changes.
Display cell value in shape or text box
Display cell value in chart title
Display cell value in a picture
Note: The methods provided in this tutorial are tested in Excel 2021; there may be some differences in different Excel versions.
Display cell value in chart title
1. Insert a shape by clicking "Insert" > "Shape" in "Illustrations" group, selecting one shape from the expanded menu.
Note: Inserting textbox by clicking "Insert" > "Textbox" in "Text" group.
2. Then drag the cursor to draw the shape or textbox in current worksheet.
 |  |
3. Then keep the shape or textbox selected, go to the formula bar, type the equal sign (=).
4. After typing the equal sign, select a cell or a range of cells that you want to display in the shape or textbox, then press "Enter" key.
Now the cell contents have been displayed in the shape or textbox, and it is changed as the cell contents changed.
 |  |
Display cell value in chart title
1. Click on the chart that you want to display cell value in its title, then go to the "Chart Design" tab.
2. Click "Add Chart Element" > "Chart Title", then choose one type of titles you want to insert.
3. Then select the title, go to the formula bar, type the equal sign (=), and select the cell(s) that you want to display the contents.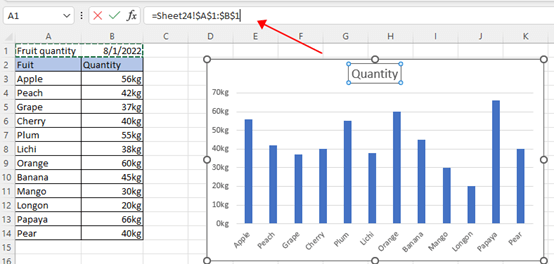
4. Press "Enter" key, now the contents of the specified cell(s) have been displayed in the chart title.
Display cell value in a picture
If you want to display the cell contents as a picture as the below screenshot shows, you need to add the "Camera" tool to the" Quick Access Toolbar" firstly.
1. Enable Excel, click "File" > "Options" to enable the "Excel Options" window.
2. Click "Quick Access Toolbar" from the left pane, then go to the right section, choose "All Commands" from the drop-down list of" Choose commands from" section, then scroll the scroll bar to find "Camera" command, click it and click "Add" button to add into the" Custom Quick Access Toolbar s"ection. Click "OK".
Now you can see the "Camera" command has added in the "Quick Access Toolbar.![]() "
"
3. Select the cell(s) that you want to display in a picture, then click "Camera" button, then press "Enter" key. Now the selected cells have been shot as a picture.
 |  |
Note that the contents in a picture will be changed as the cell contents change.
Other Operations (Articles)
How To Fix/Lock Background Color In A Sheet
Sometimes, when you share a sheet with others to edit, you may want to lock the background color in a range of cells and prevent them to be changed.
How To Reduce Excel File Size?
Sometimes, it will take minutes to open or save if the Excel file is too large. For solving this problem, here in this tutorial, it tells you how to reduce the Excel file size by removing the contents or formats which are unnecessary or never used.
Excel: How To Create Or Insert A Bookmark
Have you ever imagined creating or inserting a bookmark for quickly jumping to a specific data range while there is a lot of data in a worksheet or a workbook?
How to apply shading to odd or even (alternative) rows/columns in Excel?
While designing a worksheet, many people tend to apply shading to odd or even (alternative) rows or columns in order to make the worksheet more visual. This article will show you two methods to apply shading to odd or even rows/columns in Excel.
Best Office Productivity Tools
Supercharge Your Excel Skills with Kutools for Excel, and Experience Efficiency Like Never Before. Kutools for Excel Offers Over 300 Advanced Features to Boost Productivity and Save Time. Click Here to Get The Feature You Need The Most...
Office Tab Brings Tabbed interface to Office, and Make Your Work Much Easier
- Enable tabbed editing and reading in Word, Excel, PowerPoint, Publisher, Access, Visio and Project.
- Open and create multiple documents in new tabs of the same window, rather than in new windows.
- Increases your productivity by 50%, and reduces hundreds of mouse clicks for you every day!
All Kutools add-ins. One installer
Kutools for Office suite bundles add-ins for Excel, Word, Outlook & PowerPoint plus Office Tab Pro, which is ideal for teams working across Office apps.
- All-in-one suite — Excel, Word, Outlook & PowerPoint add-ins + Office Tab Pro
- One installer, one license — set up in minutes (MSI-ready)
- Works better together — streamlined productivity across Office apps
- 30-day full-featured trial — no registration, no credit card
- Best value — save vs buying individual add-in