Full Guide for Excel's Quick Analysis Tool (with Examples)
When faced with a dataset and unsure where to start your analysis, Excel offers a semi-automatic solution: the Quick Analysis tool. This feature provides an array of simple analyses related to formatting, charts, and more. This tutorial will delve into the Quick Analysis tool in detail, offering examples to illustrate its practical application.
Where is Quick Analysis tool?
How to use Analysis tool?
Formatting
Charts
Totals
Tables
Sparklines
Why Quick Analysis tool not appear?
Video: How to use Quick Analysis in Excel
What is Quick Analysis tool?
The Quick Analysis tool in Excel is a dynamic feature that offers immediate access to various analytical tools like formatting, charts, and tables based on the selected data. It simplifies the process of analyzing complex datasets, making it easier to visualize and understand data trends and patterns.

Unlock Excel Magic with Kutools AI
- Smart Execution: Perform cell operations, analyze data, and create charts—all driven by simple commands.
- Custom Formulas: Generate tailored formulas to streamline your workflows.
- VBA Coding: Write and implement VBA code effortlessly.
- Formula Interpretation: Understand complex formulas with ease.
- Text Translation: Break language barriers within your spreadsheets.
Where is Quick Analysis tool?
Unlike traditional Excel features found on the ribbon or menus, the Quick Analysis tool operates discreetly.
How to Access
Start by selecting the data range you want to analyze. Look for the Quick Analysis button in the bottom-right corner of the selected range. If it's not visible, you can press Ctrl + Q to bring it up.

Then click the Quick Analysis button to display the menu. The Quick Analysis menu offers different categories for data analysis. Hovering over an option previews the effect, and clicking it applies the feature.

- Using Ctrl + Q on a single cell automatically selects the contiguous data set.
- This feature is inactive on blank cells, columns, or rows.
How to use Analysis tool?
Excel's Quick Analysis tool is a powerful feature that offers quick access to various data analysis methods. Let's dive into each of its five categories, exploring their applications, suitable scenarios, and some practical examples.
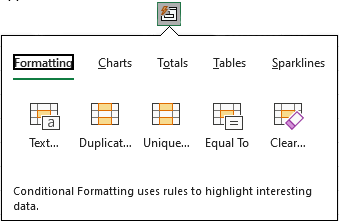
Formatting
Used for visually distinguishing data based on certain criteria, like highlighting top values, or identifying duplicates. The available options depend on the data type you’ve selected:
- For numeric data: You can use data bar, color scales, icon sets, top 10%, greater than a specific value to highlight the relevant values.
- For dates: You can color the dates in last month, last week, or greater than, less than, equal to a specific date.
- For texts: You can highlight the duplicates or unique values.
Example: Highlight the values that greater than 1200 in a column
Select the column that you want to highlight the values greater than 1200, click the Quick Analysis button, go to the Formatting tab, and click Greater.

In the popping Greater Than dialog, type 1200 into the left textbox, then specify the highlight type in the right drop-down list. Then click OK.

Now the values which are greater than 1200 are highlighted with specific color.

Keyboard shortcut for Quick Analysis Formatting: Ctrl + Q then F.
Charts
Ideal for visualizing data patterns and trends. It offers various chart types like bar, column, line, and pie charts.
Depending on the data you select, Excel's Quick Analysis tool presents the most suitable chart options to graphically depict your data. This aids in visualizing patterns, trends, and relationships more effectively.
Example: Create a chart based on a dataset
Select the dataset that you want to create a chart, click the Quick Analysis button, go to the Charts tab, and choose a chart type. If you want to find more chart types, click More….

After clicking the chart, the chart is immediately inserted.

Keyboard shortcut for Quick Analysis Charts: Ctrl + Q then C.
Transform Data into Insight with Kutools for Excel Charts!
Easily create diverse, dynamic charts with just a few clicks. Discover effortless visualization for impactful presentations. Elevate your data game! Explore & Download.


Totals
The Totals feature in Excel's Quick Analysis tool allows for quick calculations of various summary statistics like sum, average, count, percentage total, and running total, adapting to your data type.
For numeric value, you can sum, count, average, %total and do other calculations.
For text data, you're limited to the Count function, showing the number of cells containing text.
Totals can be applied to both rows and columns:
- For vertical summaries in columns, choose from several options highlighted in blue.
- For horizontal summaries in rows, use the right navigation arrow and select from the yellow-highlighted options that best fit your data.
Example: Sum the total prices
Select the columns that you want to sum the total numbers, click the Quick Analysis button, go to the Totals tab, and choose Sum.

Then the sum of total prices is calculated in the last cell of the column in the dataset.

Keyboard shortcut for Quick Analysis Totals: Ctrl + Q then O.
Tables
Convert your data into a professionally managed Excel table with built-in filtering, sorting, and auto-expansion. For deeper analysis, easily create a PivotTable on a new sheet using your selected data. Also, you can directly use its recommended PivotTables.
Example: Create a PivotTable to show the sums of sales amount by departments
Select the dataset that you want to create a PivotTable, click the Quick Analysis button, go to the Tables tab, then browse if there is a PivotTable you want and click it. If not, click More to create a blank one and specify the rows and columns.

Then a new sheet is created with a PivotTable.

Keyboard shortcut for Quick Analysis Tables: Ctrl + Q then T.
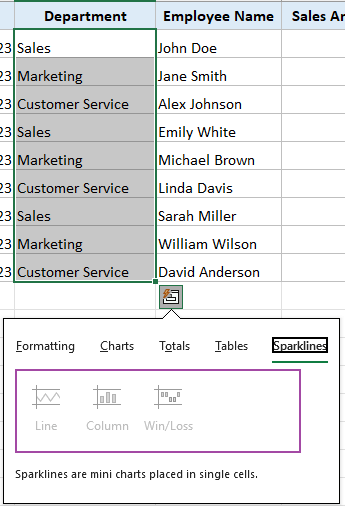
Sparklines
These are mini-charts placed in single cells, each representing a row of data, ideal for showing trends and patterns.
For text data, the options under Sparklines will change to grey.

Example: Insert sparklines to each project
Select the dataset that you want to create sparklines, click the Quick Analysis button, go to the Sparklines tab, click Line.

Then the sparklines are inserted at the right column of the dataset.

Keyboard shortcut for Quick Analysis Sparklines: Ctrl + Q then T.
Why Quick Analysis tool not appear?
If the Quick Analysis tool is not appearing, check the Excel options:
Click File tab, navigate to Excel's Options.
Ensure the Show Quick Analysis options on selection feature enabled in the settings.
If it's disabled, enabling it should make the tool accessible, then click OK to take it effect.


Excel's Quick Analysis tool is a powerful ally in data analysis, making complex tasks simpler and more intuitive. By understanding how to effectively use this tool, you can unlock new insights from your data with minimal effort. Remember, the key to mastering Excel lies in exploring and utilizing such hidden gems. For more game-changing Excel strategies that can elevate your data management, explore further here..
The Best Office Productivity Tools
Kutools for Excel - Helps You To Stand Out From Crowd
Kutools for Excel Boasts Over 300 Features, Ensuring That What You Need is Just A Click Away...
Office Tab - Enable Tabbed Reading and Editing in Microsoft Office (include Excel)
- One second to switch between dozens of open documents!
- Reduce hundreds of mouse clicks for you every day, say goodbye to mouse hand.
- Increases your productivity by 50% when viewing and editing multiple documents.
- Brings Efficient Tabs to Office (include Excel), Just Like Chrome, Edge and Firefox.