Create a bidirectional bar chart in Excel
A bidirectional bar chart is used for comparing two sets of data side by side along a vertical axis. In this tutorial, we will demonstrate how to create a bidirectional bar chart in Excel in details.
Create a bidirectional bar chart in Excel
Easily create a bidirectional bar chart with an amazing tool
Download the sample file
Video: Create a bi-directional bar chart in Excel
Create a bidirectional bar chart in Excel
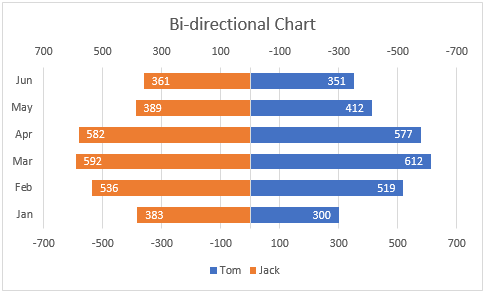
Supposing you want to create a bidirectional bar chart in Excel based on data as the below screenshot shown, please do as follows.

1. Select the whole data range, then click Insert > Insert Column or Bar Chart > Clustered Bar.

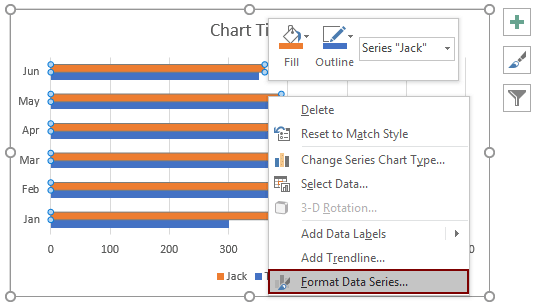
2. Then a clustered bar chart is created. Right click on any bar and select Format Data Series from the right-clicking meu.
3. In the Format Data Series pane, select the Secondary Axis option.

4. Then you can see the secondary axis is added on the top of the bars. Please right click the secondary axis, and then click Format Axis from the context menu.

5. In the opened Format Axis pane, please configure as follows:

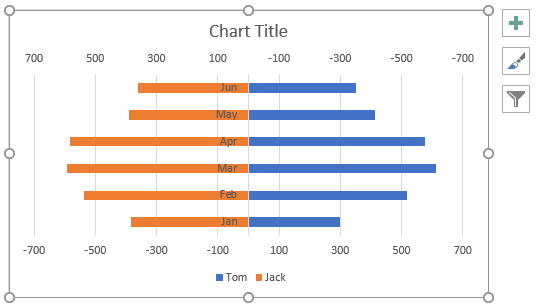
Now the chart is displayed as the below screenshot shown.

6. Click the first axis (under the bars), go to the Format Axis pane, and then set the same value in the Minimum box as step 5.
Note: In this step, keep the Values in reverse order box unchecked.

Then a bidirectional bar chart is created as the below screenshot shown.
Notes: If you want to change the location of vertical axis, widen the bars or add data labels to the bars, please do as follows.
Change the location of vertical axis


Widen the bars


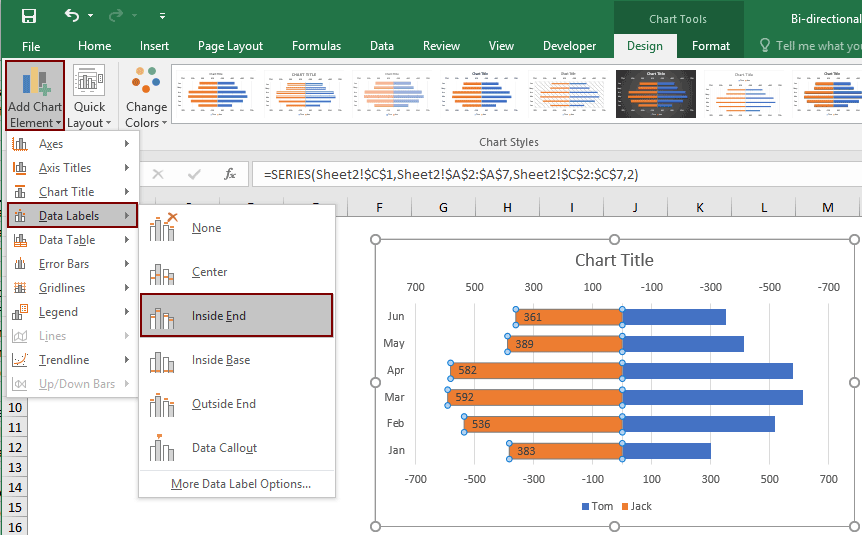
Add data labels to the bars

Modify the chart title or remove it as you need.
Now the bidirectional chart is complete.

Easily create a bidirectional bar chart in Excel
The BiDirectional Bar Chart utility of Kutools for Excelcan help you quickly create a bidirectional bar chart in Excel with several clicks only as the below demo shown.
Download and try it now! 30-day free trail
Download the sample file

Video: Create a Bi-directional chart in Excel
The Best Office Productivity Tools
Kutools for Excel - Helps You To Stand Out From Crowd
Kutools for Excel Boasts Over 300 Features, Ensuring That What You Need is Just A Click Away...
Office Tab - Enable Tabbed Reading and Editing in Microsoft Office (include Excel)
- One second to switch between dozens of open documents!
- Reduce hundreds of mouse clicks for you every day, say goodbye to mouse hand.
- Increases your productivity by 50% when viewing and editing multiple documents.
- Brings Efficient Tabs to Office (include Excel), Just Like Chrome, Edge and Firefox.