Create a Bullet chart in Excel
Normally, Bullet chart serves as a replacement for dashboard Gauge and meters, which is one of the best data visualization tool. It helps to compare a measure to one or more related measurements. For instance, we compare the target value with the actual value, and display them in the context of qualitative ranges of performance (says the fair, good, and excellent, etc.) vertically or horizontally as the below screenshot shown. We can judge the performance of the actual value at a glance according to the gradient color it locating.
This tutorial is a step-by-step guide showing two methods for you to create a vertical Bullet chart and a horizontal Bullet chart in Excel.

Create a vertical bullet chart
Create a horizontal bullet chart
Easily create a horizontal bullet chart with an amazing tool
Download the sample file
Create a vertical bullet chart
In this section, you are going to learn how to create a vertical bullet chart in details.
Firstly, prepare your data
The below table contains the sales target, each person’s actual sales, and the qualitative ranges of performance (Fair, Good and Excellent).

Create the bullet chart based on the table data
1. Select the whole table, go to the Insert tab, click Insert Column or Bar Chart > Stacked Column.

Tip: If your table only has two columns, after inserting the stacked column, you need to click Design > Switch Row/Column to swap the data in the chart. Otherwise, ignore this tip.
2. Now the stacked column is inserted, click to select all the gridlines, and then press the Delete key to remove them from the chart.

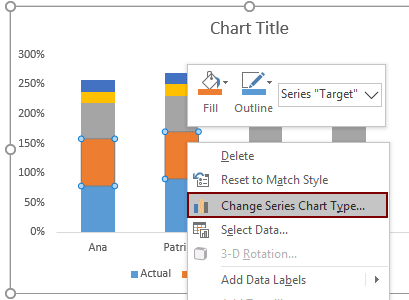
3. Right click the target data series (here is the orange bar), and then select Change Series Chart Type from the context menu.
4. Then the Change Chart Type dialog box pops up. Go to the Choose the chart type and axis for your data series section, and in the Target series name, choose Stacked Line with Marker from the Chart Type drop-down, check the Secondary Axis box and finally click the OK button.

5. And then the chart is displayed as below, please select the secondary axis, press the Delete key to remove it from the chart.

6. Right click the Target data series again, and then choose Format Data Series from the right-clicking menu.

7. In the Format Data Series pane, go to the Fill & Line tab, and then select No line in the Line section under the Line tab.

8. Click the Marker tab under the Fill & Line tab, and then go ahead to configure as follows:

9. Now go back to the chart and right click the Actual data series (the blue column in this case), select Change Series Chart Type from the right-clicking menu.

10. In the Change Chart Type dialog box, check the Secondary Axis box for the Actual series name and then click the OK button.

11. And then, right click the Actual data series again, and then choose Format Data Series from the context menu.

12. In the Format Data Series pane, specify a Gap Width (here I specify 250%) under the Series Options tab; Go to the Fill & Line tab, specify a fill color for it.

13. Specify different gradients for the Fair, Good and Excellent columns. Remove or rename the chart title as you need.
Here the final vertical bullet chart is created as the below screenshot shown.

Create a horizontal bullet chart
If you want to create a horizontal bullet chart, the method in this section can do you a favor.
Firstly, prepare your data
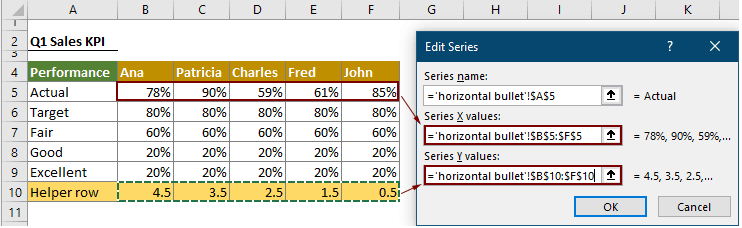
Take the above table data as an example. You need to create a helper row to get it down.
Enter number 0.5 into the last cell of the last column; enter 1.5 (0.5+1) into the previous cell. Keep adding 1 until all cells are filled with needed numbers. See screenshot:

Create the bullet chart based on the table data
1. Select the table range A4:F9 excluding the Helper row. Go to the Insert tab, and select Insert Column or Bar Chart > Stacked Bar.

Tip: If your table only has two columns, after inserting the stacked bar, you need to click Design > Switch Row/Column to swap the data in the chart. Otherwise, ignore this tip.
2. Now the stacked bar is inserted, click to select all the gridlines, and then press the Delete key to remove them from the chart.

As you can see, the names on the chart are listed in reverse order. You need to rearrange it to match the order of the original data.
3. Select the Name axis label, right click and select Format Axis from the right-clicking menu.

4. In the Format Axis pane, check the Categories in reverse order box in the Axis Options section under the Axis Options tab.

5. Select the Actual data series (the blue bar in this case), right click and select Change Series Chart Type from the right-clicking menu.

6. In the Change Chart Type dialog box, find the Actual series name in the Choose the chart type and axis for your data series box, choose Scatter from the Chart Type drop-down, and then click the OK button.

7. Remove the secondary axis from the chart. Just select it and press the Delete key.

8. Right click the chart and choose Select Data from the context menu.

9. In the Select Data Source dialog box, select Actual in the Legend Entries (Series) box, and then click the Edit button.

10. In the Edit Series dialog box, select the Actual values (here I select B5:F5) in the Series X values box, select the Helper row data (B10:F10 in this case) in the Series Y values box, and then click OK.
11. Click OK when it returns to the Select Data Source dialog box.
12. Select the Target data series (the orange bar), right click and select Change Series Chart Type from the right-clicking menu.

13. In the Change Chart Type dialog box, find the Target series name in the Choose the chart type and axis for your data series box, choose Scatter from the Chart Type drop-down, and then click the OK button.

14. Right click the chart and choose Select Data from the context menu.

15. In the Select Data Source dialog box, select Target in the Legend Entries (Series) box, and then click the Edit button.

16. In the Edit Series dialog box, select the Target values (here I select B6:F6) in the Series X values box, select the Helper row data (B10:F10 in this case) in the Series Y values box, and then click OK.

17. Click OK when it returns to the Select Data Source dialog box.
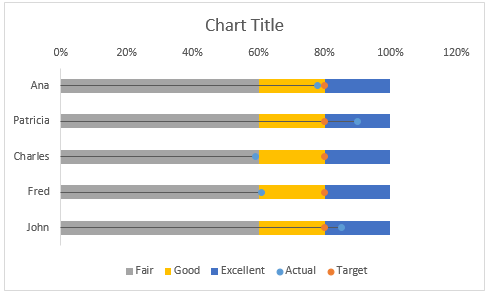
Now the chart is displayed as the below screenshot shown.

18. Select the Actual data series (the blue dots), go to the Design tab, and then click Add Chart Element > Error Bars > Standard Error.

19. Select the horizontal error lines, right click and select Format Error Bars.

20. In the Format Error Bars pane, you need to do the below settings.

21. Then, in the popped out Custom Error Bars dialog box, select the Actual values (B5:F5) in the Negative Error values box, and then click OK.

22. Remove the vertical error lines from the chart. And then you will get a bullet chart as follows.
23. Select the horizontal error lines again. Go to the Fill & Line tab in the Format Error Bars pane, and then specify a fill color and width for the lines.

24. Select the Actual data series (the blue dots), go to the Fill & Line tab in the Format Data Series pane, click Marker, and then select None in the Marker Options section.

25. Specify different gradients for the Fair, Good and Excellent bars, adjust the bar’s widths, remove or rename the chart title as you need. Now the chart is shown as below:

Then you need to replace the orange dots (the target data series) in the bullet chart with specified vertical lines.
26. Go to the Insert tab, click Shapes > Line as the below screenshot shown.

27. Draw a vertical line on the chart. Select the line, go to the Format tab, and then specify its Theme color and Weight under the Shape Outline drop down list. And you will get a vertical line as the below screenshot shown.

28. Select the vertical line and press the Ctrl + C keys to copy it.
29. Now select the Target data series (the orange dots), and then press the Ctrl + V keys to replace all dots with the vertical line. Then remove the vertical line you have drawn in step 27.
Here is the final Excel bullet chart.

Easily create a vertical or horizontal bullet chart in Excel
The Bullet Chart utility of Kutools for Excelcan help you quickly create a vertical or horizontal bullet chart in Excel with several clicks only as the below demo shown.
Download and try it now! 30-day free trail

Download the sample file

The Best Office Productivity Tools
Kutools for Excel - Helps You To Stand Out From Crowd
Kutools for Excel Boasts Over 300 Features, Ensuring That What You Need is Just A Click Away...
Office Tab - Enable Tabbed Reading and Editing in Microsoft Office (include Excel)
- One second to switch between dozens of open documents!
- Reduce hundreds of mouse clicks for you every day, say goodbye to mouse hand.
- Increases your productivity by 50% when viewing and editing multiple documents.
- Brings Efficient Tabs to Office (include Excel), Just Like Chrome, Edge and Firefox.