Create bell curve chart in Excel
The bell curve char also named as normal distribution curve chart reflects the distribution of random variables. In a bell curve chart, the highest point is the one that has the highest probability of occurring, and the probability of occurrences gradually decrease towards either side of the curve as below screenshot shown.
Normally, the bell curve chart is used to evaluate exam grades or employee performance appraisals which help you to identify the best, average and poor performers in the team. This tutorial will talk about how to create a bell curve chart in Excel worksheet.
- Create a bell curve or normal distribution curve chart in Excel
- Download Bell Curve Chart sample file
- Video: Create bell curve chart in Excel
Create a bell curve or normal distribution curve chart in Excel
Supposing, you have a list of scores of all your students, now you want to create a bell curve chart based on the grades. Please do with the following steps:
1. Click a cell in the Score column, and then click Data > Sort Smallest to Largest to sort the data in ascending order, see screenshots:
 |  |
2. Now, you should calculate two helper values, mean value and standard deviation value, please apply the following formulas into cell F1 and F2 separately:
Standard Deviation: =STDEV.P(B2:B17)

3. After getting the two helper values, please create a helper column beside the original data, enter the below formula into cell C2:
=NORMDIST(B2,$F$1,$F$2,FALSE) Excel 2007 or earlier versions
4. And then, drag the fill handle down to the cells you want to apply this formula.

5. Then, select the data in Score and new helper columns, click Insert > Insert Scatter (X,Y) or Bubble Chart > Scatter with Smooth Lines and Markers, see screenshot:

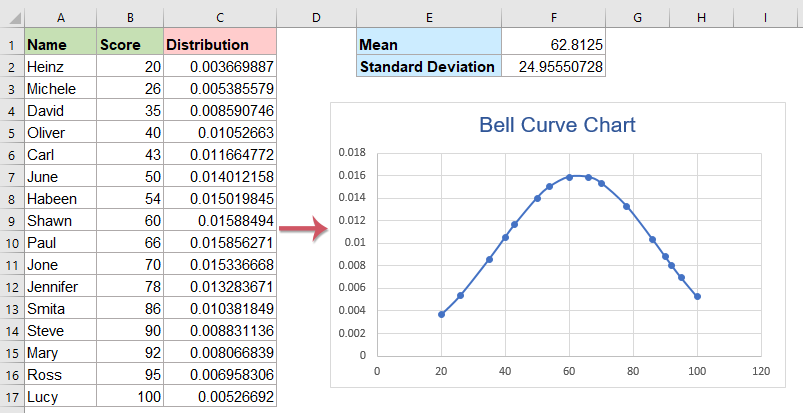
6. And then, a bell curve chart has been created at once. From the chart, you can see the lower marks students are on the left side of the curve, higher marks students are on the right side of the curve and most of the students in the middle of the curve, see screenshot:

7. At last, you can change the chart title to your own, see screenshot:

Download Bell Curve Chart sample file

Video: Create bell curve chart in Excel
The Best Office Productivity Tools
Kutools for Excel - Helps You To Stand Out From Crowd
Kutools for Excel Boasts Over 300 Features, Ensuring That What You Need is Just A Click Away...
Office Tab - Enable Tabbed Reading and Editing in Microsoft Office (include Excel)
- One second to switch between dozens of open documents!
- Reduce hundreds of mouse clicks for you every day, say goodbye to mouse hand.
- Increases your productivity by 50% when viewing and editing multiple documents.
- Brings Efficient Tabs to Office (include Excel), Just Like Chrome, Edge and Firefox.