Create box and whisker chart in Excel
In Excel, a box and whisker chart, also named as box plots is used to display the statistical analyses which helps to show you how numbers are distributed in a set of data. For example, with the help of the box and whisker chart, you can display the statistical data of test scores between different subjects to identify which subject need more attention for the students.
In this article, I will talk about how to create a box and whisker chart in each version of Excel.
- Create box and whisker chart in Excel 2016 and later versions
- Create box and whisker chart in Excel 2013 and earlier versions
- Download Box and Whisker Chart sample file
- Video: Create box and whisker chart in Excel
In the box and whisker chart, it shows a five-number summary of data – minimum value, first quartile (Q1) , median, third quartile (Q3) and maximum value.
The bottom line connects with box is representing the minimum value, the top line connects with the box is the maximum value in data, the box indicates the range between the first and the third quartile, the line of median divides the box into interquartile range.
The Explanation of each five numbers:
- Minimum Value: The minimum or smallest value in the data set;
- First Quartile: The middle value between the minimum and median—25th percentile;
- Median: The middle value of in the data set;
- Third Quartile: The middle value the median and the maximum—75th percentile;
- Maximum Value: The maximum or largest value in the data set.

Create box and whisker chart in Excel 2016 and later versions
In Excel 2016, 2019 and Office 365, a built-in Box and Whisker chart has been supported for Excel users. To create a box and whisker chart quickly and easily, please do with the following steps:
1. Select the data that you want to create box and whisker chart based on.

2. Then click Insert > Insert Statistic Chart > Box and Whisker, see screenshot:

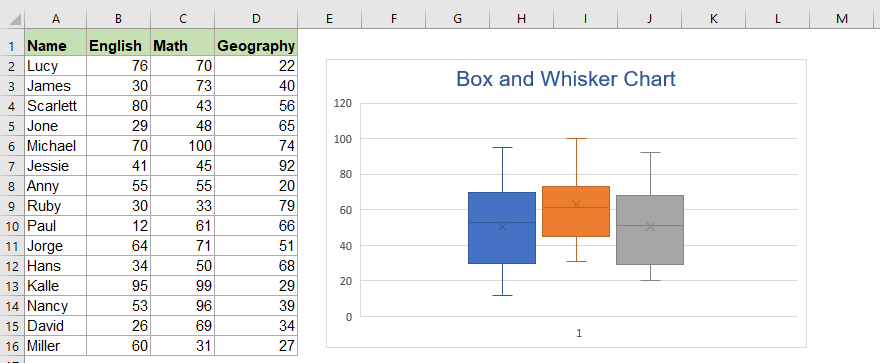
3. And then, a box and whisker chart will be inserted at once, see screenshot:

4. Then, select and delete the horizontal axis, and you can also edit the chart title and insert the legend as you need, see screenshot:

Create box and whisker chart in Excel 2013 and earlier versions
There is no the Box and Whisker chart type in Excel 2013 and earlier versions, in this case, you should create a box and whisker chart step by step.
Step1: Prepare the data range to create box and whisker chart based on
Supposing you have the following data range:

1. Create a second table for calculating the minimum value, first quartile value, median value, third quartile value and maximum value by using below formulas:
First Quartile: =QUARTILE.INC(B2:B16, 1)
Median Value: =QUARTILE.INC(B2:B16, 2)
Third Quartile: =QUARTILE.INC(B2:B16, 3)
Maximum Value: =MAX(B2:B16)

2. After inserting the formulas, and you will get the following result:

3. Then, create a third table based on the second table to calculate the differences, please apply the below formulas:
First Quartile-Minimum: =G4-G3
Median-First Quartile: =G5-G4
Third Quartile-Median: =G6-G5
Maximum-Third Quartile: =G7-G6

4. After applying the formulas, you will get the result as below screenshot shown, this data range will be used to create the box and whisker chart.

Step2: Create a stacked column chart
5. After getting the data range to create the box and whisker chart based on, select the third table data, and then, click Insert > Insert Column or Bar Chart > Stacked Column, see screenshot:

6. And a stacked column chart has been inserted into the worksheet as below screenshot shown:

7. Click to select the chart, and then click Switch Row/Column option under the Design tab, and the chart will be converted to the below chart, see screenshots:
 |  |
Step3: Format the stacked column chart to box and whisker chart
8. Now, you should hide the bottom data series, right click any one of the bottom data series, and choose Fill > No Fill from the right menu, see screenshot:

9. And then, the bottom data series are invisible now, and you can delete the chart tile and legend as well, see screenshot:

10. Next, you should create whiskers by replacing the topmost and second from bottom segments, right click the top bar of the chart, and then choose Fill > No Fill, see screenshot:

11. Now, go on clicking Design tab on the ribbon, and then click Add Chart Element > Error Bars > Standard Deviation, and you will get the below result:

12. Then, right click the error bar, and choose Format Error Bars from the context menu, see screenshot:

13. In the Format Error Bars pane, under the Error Bar Options tab, please do the following operations:
- Select Minus option from the Direction section;
- Select No Cap from the End Style section;
- From the Error Amount section, click Percentage option, and enter 100 into the text box.

14. Then, you can also format the lines, please go on clicking the Fill & Line tab, do the following operations:
- Select Solid line under Line section;
- Specify a color you need from the Color drop down list;
- Then, type 1.5pt in the Width text box.

15. Then, repeat the above step10 - step14 for the second lower bottom data series. See below demo:

16. And you will get the box and whisker chart as below screenshot shown:

17. The box and whisker chart usually drawing in one fill color, so, you should change the fill color and border color for the boxes, please do as this:
- Right click to select the top boxes, and choose Fill, then select one fill color you like, such as light bule.
- Then, choose one dark blue from the Outline drop down list, go on selecting 1½ pt from the Weight section.

18. Repeat the above step 17 for formatting the bottom boxes as well. And now, the box and whisker chart has been created successfully, see screenshot:

Download Box and Whisker Chart sample file

Video: Create Box and Whisker chart in Excel
The Best Office Productivity Tools
Kutools for Excel - Helps You To Stand Out From Crowd
Kutools for Excel Boasts Over 300 Features, Ensuring That What You Need is Just A Click Away...
Office Tab - Enable Tabbed Reading and Editing in Microsoft Office (include Excel)
- One second to switch between dozens of open documents!
- Reduce hundreds of mouse clicks for you every day, say goodbye to mouse hand.
- Increases your productivity by 50% when viewing and editing multiple documents.
- Brings Efficient Tabs to Office (include Excel), Just Like Chrome, Edge and Firefox.