Create a forecast chart in Excel
By default, Excel provides a build-in feature to help creating a new worksheet to predict data trends. Apart from creating a forecast worksheet, this article is going to show you how to create a forecast chart directly based on data in a worksheet.
Create a simple forecast chart
Create a forecast chart based on a threshold value
Easily create a forecast chart with an amazing tool
Download the sample file
Video: Create forecast chart in Excel
Create a simple forecast chart
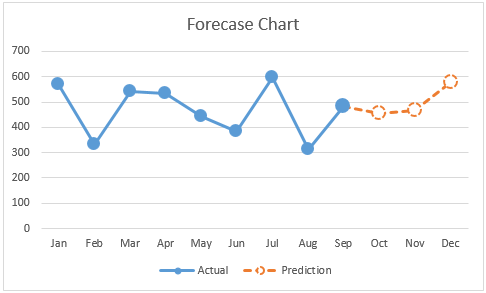
Supposing you have a sales table containing the actual sales data from Jan to Sep as the below screenshot shown, and you want to predict the sales trends of Oct, Nov and Dec within a chart, you can do as follows to get it down.

1. Firstly you need to create a column containing the prediction data of Oct, Nov and Dec as the below screenshot shown.
Note: Next to the last actual data cell, enter the same data.

2. Select the whole table data, click Insert > Insert Line or Area Chart > Line with Markers.

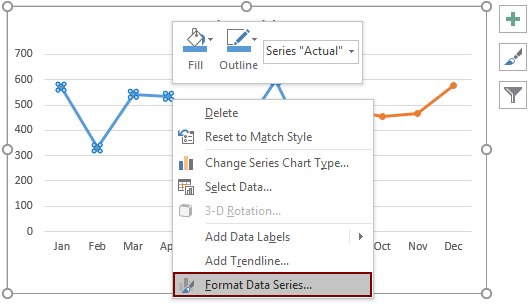
3. Right click the blue line (the Actual series) and then select Format Data Series from the right-clicking menu.
4. In the opening Format Data Series pane, please configure as follows.

5. Now you need to configure the prediction series. Select the orange line (the prediction series), and in the Format Data Series pane, do as follows.


6. As the Sep data is actual, we need to configure this marker to display as the Actual series.
Click this marker twice to only select it, and in the Format Data Point pane, separately select the same Fill color and the Border color as the color of the Actual series, and then choose Solid from the Dash type drop down list.

After that, you can see the marker of Sep is changed as follows.

7. Change the chart title as you need. Then a simple forecast chart is completed.
Create a forecast chart based on a threshold value
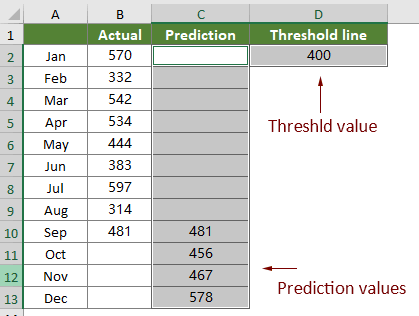
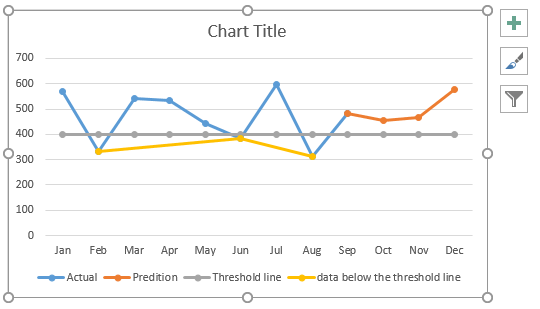
Supposing you want to create a forecast chart based on a threshold value as the below screenshot shown, method in this section will do you a favor.

1. Add two new columns to the original data range, which separately containing the prediction data and the threshold value. See screenshot:
Note: Next to the last actual data cell, enter the same value.
2. You need to create an intermediate data table based on the original data range. This table will be used to create the forecast chart.

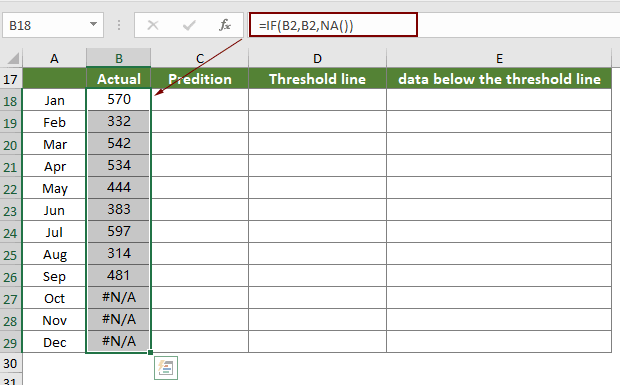


Note: In the above formulas, all the reference cells are from the original data range.
3. Select the whole intermediate data table, click Insert > Insert Line or Area Chart > Line with Markers.

Then a chart is inserted in current worksheet as the below screenshot shown.
4. Now you need to format the Actual series and the Prediction series until the chart is displayed as below. Click to know how.
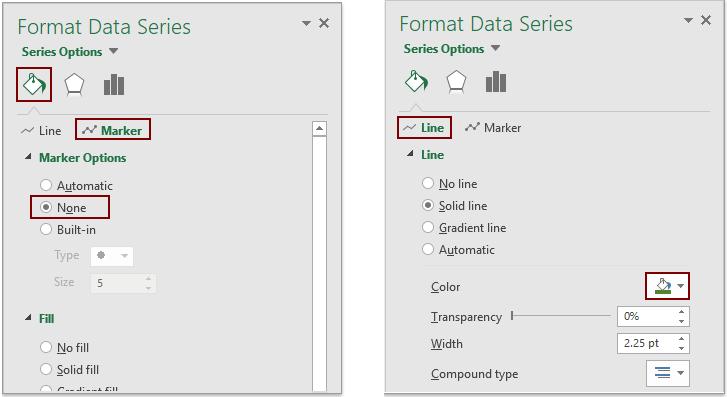
5. For the data series below the threshold line, you need to enlarge the markers, change the fill color and hide the line. Please select this series (the yellow line in the chart), and in the Format Data Series pane, configure as follows.


Now the chart is displayed as the below screenshot shown.

6. Select the threshold line in the chart, and in the Format Data Series pane, do as follow to hide the markers and change the line color.
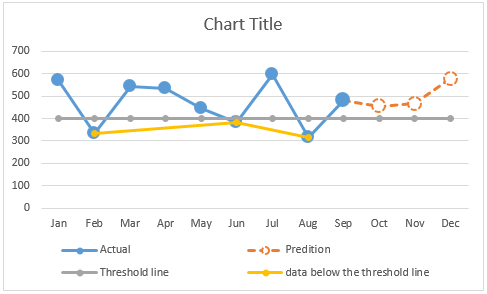
7. Change the chart title as you need.
Then the forecast chart based on threshold value is completed as the below screenshot shown.
Easily create a forecast chart in Excel
The Forecast Chart utility of Kutools for Excelcan help you quickly create a simple forecast chart or a forecast chart based on a threshold value in Excel with several clicks only as the below demo shown.
Download and try it now! 30-day free trail
Download the sample file
