Create a percentage ball chart in Excel
Normally, we are displaying progress with an advancing bar chart. However, In Excel, we can visually display percentage completion with other different charts, such as a progress circle chart (click to see how to make this chart). This tutorial demonstrates steps to create a ball chart that tracks the percentage completion of a project visually in Excel.
Create a percentage ball chart in Excel
Easily create a percentage ball chart with an amazing tool
Download the sample file
Video: Create band chart in Excel
Create a percentage ball chart in Excel
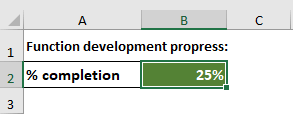
Supposing you are recording the percentage completion of a project in a cell as the below screenshot shown, you can do as follows step by step to create a percentage ball chart to visually display the percentage completion.
1. Select the cell containing the percentage completion, then click Insert > Insert Column or Bar Chart > Clustered Column.

2. Right click the chart and choose Select Data in the right-clicking menu.

3. In the Select Data Source dialog box, click the Add button.

4. In the popping up Edit Series dialog box, click OK directly without any configuration.

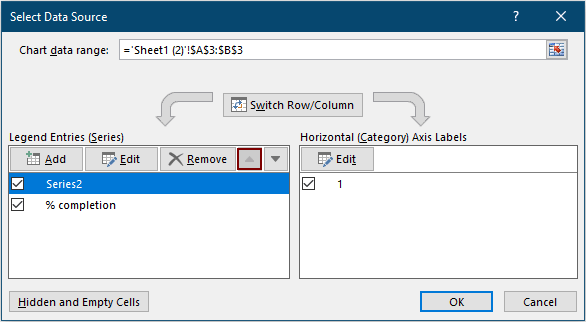
5. When it returns to the Select Date Source dialog box, select the new added series (Series2) and click the Move Up arrow to move this series to the top of the list box, and then click OK to save the changes.
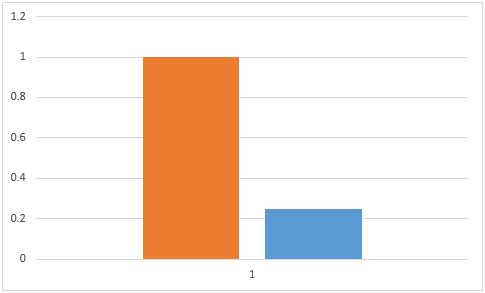
Now the chart is displayed as follows.
6. Click Insert > Shapes > Oval. Then draw a circle in the worksheet with holding the Shift key.

7. Copy the inserted circle and paste to have the second one. Then format the second circle with another color: please select it, then click Format > Shape Fill, and then choose the fill color as you need.

Now there are two circles in your worksheet as the below screenshot shown.

8. Now you need to replace the columns in the chart with circles. Select one of the circles, press the Ctrl + C keys to copy it, go to the chart, select one of the columns, and then press the Ctrl + V keys to paste the circle. Repeat the operation to copy the other circle to the column that is left in the chart. See the below demo:
9. Right click on the series (the small circle) in the chart, and then select Format Data Series from the context menu.

10. In the Format Data Series pane, please configure as follows.
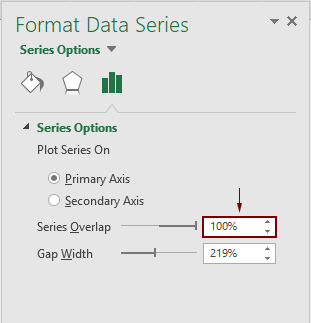

Now two ovals are overlapping in the chart as the below screenshot shown.

11. Adjust the chart by dragging the Chart Area until the shape turns to a circle ball.

12. Click Insert > Text Box, and then draw a text box on the ball.
13. Keep the text box selected, go to the Format (Drawing Tools) tab, and then select No Fill and No Line separately from the Shape Fill and Shape Outline drop-down lists.

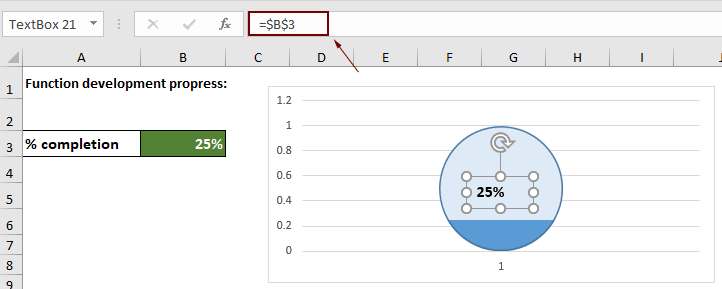
14. Keep the text box selected, type an equal sign = into the Formula bar, click the cell containing the percentage completion value and then press the Enter key.
15. Now you need to format the text box as follows.
16. Remove the X-axis, Y-axis and the gridlines.
Then the percentage ball chart is complete as the below screenshot shown.

Notes:
Easily create a vertical or horizontal bullet chart in Excel
The Percentage Ball Chart utility of Kutools for Excelcan help you quickly create a percentage ball chart in Excel with several clicks only as the below demo shown.
Download and try it now! 30-day free trail
Download the sample file
