Create a step chart in Excel
A step chart is used to show data which changes at irregular intervals, and keep constant for a period until the next change comes. In fact, it is a Line chart but uses vertical and horizontal lines to connect the data points (The below screenshot makes a comparison between a normal Line chart and a Step chart). In Excel, there is no build-in function to help users directly create a Step chart. In this tutorial, we are providing a step-by-step guide to help you easily create a Step chart in Excel.

Create a step chart by creating helper data range
Create a step chart by changing the chart formula
Easily create a step chart with an amazing tool
Download the sample file
Video: Create step chart in Excel
Create a step chart by creating helper data range
Please do as follows step by step to create a step chart in Excel.
Firstly, prepare your data
Supposing you have a sales table as the below screenshot shown, you need to create a helper data range based on the original table as follows.

1. Copy the whole table range (A1:B12) and then paste it to a new range.

2. Delete the first date cell and the last sales cell from the new table range.
Tips: Right click the first date cell and the last sales cell, select Delete from the right-clicking menu. In the popping up Delete dialog box, click the OK button. Then the remaining cells are shifted up or left automatically.

3. Copy the original table range (exclude headers), and then paste it below the new table range you created in step 2. See screenshot:

Create a Step Chart based on the helper data range
1. Select the new table range (D1:E22), click Insert > Insert Line or Arear Chart > Line (Unser the 2-D Line section).

Then the step chart is created immediately as the below screenshot shown.

Notes:
- Before applying this method, make sure the dates in the original Date column are in ascending order. If not, the step chart may not create correctly.
- If there is a Year formatting column instead of Date in the original table, after following the above steps, you will get a chart as the below screenshot shown. You need to go ahead to configure until it turns up as a Step chart.


Create a step chart by changing the chart formula
If you don’t want to create a helper data, or the dates in the Date column is not in ascending order, you can still create a Step chart in Excel with the below formula.
1. Select the original table data you will create a step chart based on. Click Insert > Insert Line or Arear Chart > Line (Unser the 2-D Line section).

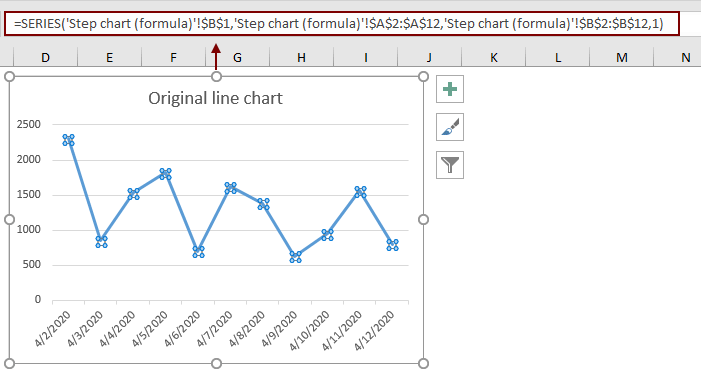
2. Select the series in the chart, you will see a formula is displayed in the Formula Bar. Pease replace it with the below formula.
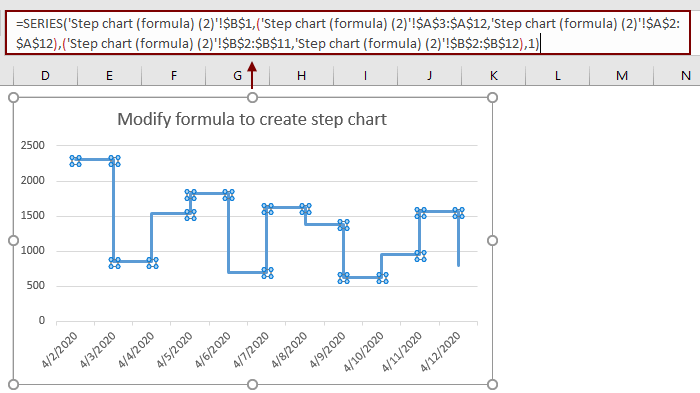
=SERIES('Step chart (formula)'!$B$1,('Step chart (formula)'!$A$3:$A$12,'Step chart (formula)'!$A$2:$A$12),('Step chart (formula)'!$B$2:$B$11,'Step chart (formula)'!$B$2:$B$12),1)
The original chart and formula:
The Step chart and the final formula:
Notes:

You can change them based on your needs.
Easily create a step chart in Excel with several clicks only
The Step Chart utility of Kutools for Excelcan help you easily create a step chart in Excel with several clicks only as the below demo shown.
Download and try it now! 30-day free trail
Download the sample file

Video: Create step chart in Excel
The Best Office Productivity Tools
Kutools for Excel - Helps You To Stand Out From Crowd
Kutools for Excel Boasts Over 300 Features, Ensuring That What You Need is Just A Click Away...
Office Tab - Enable Tabbed Reading and Editing in Microsoft Office (include Excel)
- One second to switch between dozens of open documents!
- Reduce hundreds of mouse clicks for you every day, say goodbye to mouse hand.
- Increases your productivity by 50% when viewing and editing multiple documents.
- Brings Efficient Tabs to Office (include Excel), Just Like Chrome, Edge and Firefox.