Excel CHISQ.TEST function
The CHISQ.TEST function calculates the chi-squared distribution of two provided data sets (the observed and expected frequencies), which can be used to test the independence of two categorical variables.
Tips: To learn more about the chi-squared distribution, you can visit this page on Wikipedia.
Note: This CHISQ.TEST function is only available in Excel 2010 and later versions.
Syntax
=CHISQ.TEST(actual_range, expected_range)
Arguments
Remarks
Return value
It returns a numeric value.
Example
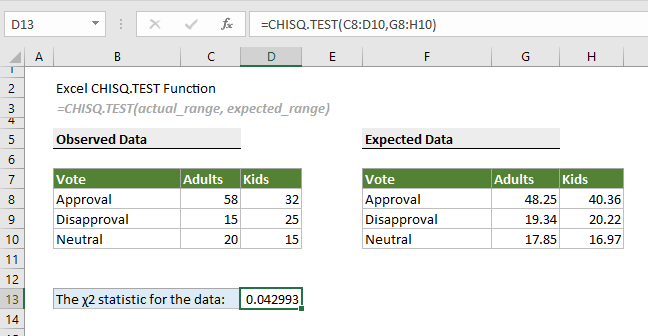
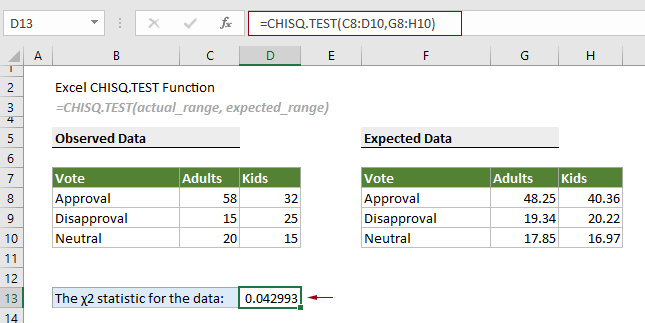
To calculate the chi-squared distribution of two provided data sets (the observed and expected data in the screenshot below), you can do as follows.
Select a cell to output the result, for example D13, enter the formula below and press the Enter key.
=CHISQ.TEST(C8:D10,G8:H10)
Related Functions
Excel CHISQ.INV function
The CHISQ.INV function calculates the inverse of the left-tailed probability of the chi-squared distribution.
Excel CHISQ.INV.RT function
The CHISQ.INV.RT function calculates the inverse of the right-tailed probability of the chi-squared distribution.
Excel CONFIDENCE.NORM function
The CONFIDENCE.NORM function uses a normal distribution to calculate the confidence interval for a population mean.
Excel CONFIDENCE.T function
The CONFIDENCE.T function uses a student’s distribution to calculate the confidence interval for a population mean.
The Best Office Productivity Tools
Kutools for Excel - Helps You To Stand Out From Crowd
Kutools for Excel Boasts Over 300 Features, Ensuring That What You Need is Just A Click Away...
Office Tab - Enable Tabbed Reading and Editing in Microsoft Office (include Excel)
- One second to switch between dozens of open documents!
- Reduce hundreds of mouse clicks for you every day, say goodbye to mouse hand.
- Increases your productivity by 50% when viewing and editing multiple documents.
- Brings Efficient Tabs to Office (include Excel), Just Like Chrome, Edge and Firefox.