
Excel CONFIDENCE.NORM function

The CONFIDENCE.NORM function uses a normal distribution to calculate the confidence interval for a population mean.

Tips:

To learn more about the Normal Distribution, you can visit this page on Wikipedia.
To learn more about the Confidence Interval, you can visit this page on Wikipedia.

Note: This CONFIDENCE.NORM function is only available in Excel 2010 and later versions.

Syntax

=CONFIDENCE.NORM(alpha, standard_dev, size)

Arguments

Alpha (required): The significance level used to calculate the confidence level, which equals to 1 – confidence level. A significance level of 0.05 equals to a confidence level of 95%.
Standard_dev (required): The population standard deviation for the data range.
Size (required): The sample size.

Remarks

1. The #NUM! error occurs if any of the following conditions is meet:
-- "Alpha" ≤ 0 or ≥ 1;
-- "Standard_dev" ≤ 0;
-- "Size" < 1.
2. The #VALUE! error occurs when any of the supplied arguments is non-numeric;
3. If “size” is not an integer, it will be truncated;
4. As the confidence interval is a range of values, to calculate the confidence interval for a population mean, the confidence value returned by the CONFIDENCE.NORM function should be added to, and subtracted from the sample mean.
Confidence Interval = Sample Mean ± CONFIDENCE

Return value

It returns a numeric value.

Example

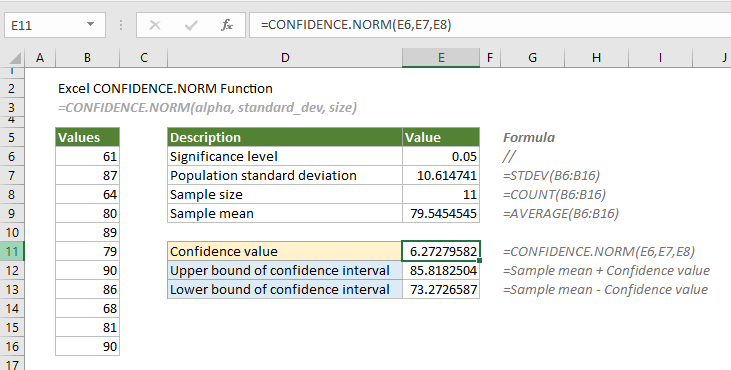
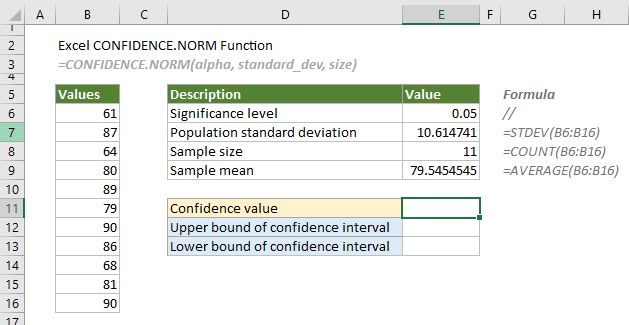
Supposing there is a list of values in the range B6:B16. To calculate the confidence interval for the population mean using a normal distribution, you need to do as follows.

Firstly, you need to provide the significance level (usually be 0.05, which equals to a confidence level of 95%), the standard deviation, the sample size, and the sample mean for the data range.

In cell E7, apply the following formula to calculate the population standard deviation for the data range.

=STDEV(B6:B16)

In cell E8, apply the following formula to calculate the sample size.

=COUNT(B6:B16)

In cell E9, apply the following formula to calculate the sample mean.

=AVERAGE(B6:B16)

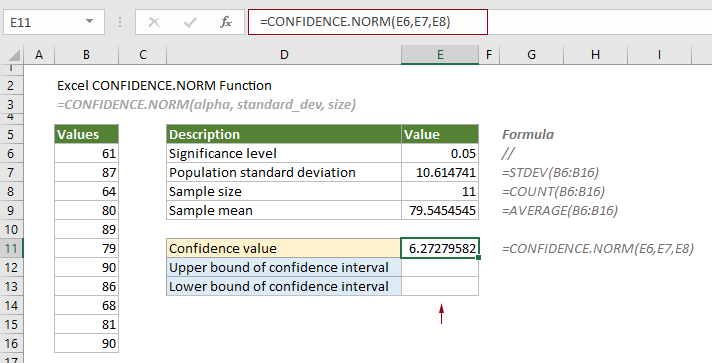
1. Here we calculate the confidence value. Select a cell, for example E11, enter the formula below and press the Enter key to get the result.

=CONFIDENCE.NORM(E6,E7,E8)

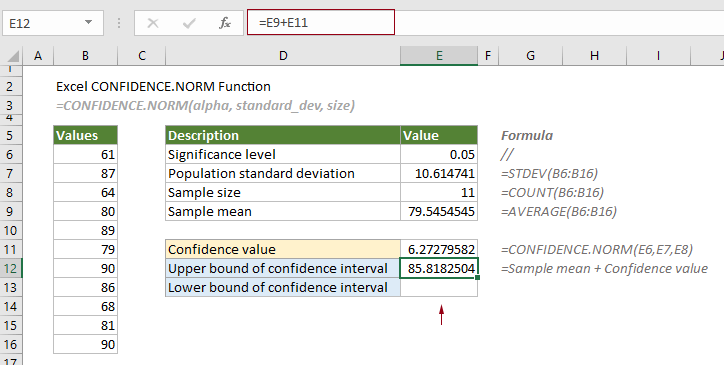
As the interval is generally defined by its lower and upper bounds. The next steps will calculate the lower and upper bounds of the confidence interval.

2. Select a cell (say E12) to output the upper bound, enter the formula below and press the Enter key.

=E9+E11

2. Select a cell (say E13) to output the lower bound, enter the formula below and press the Enter key.

=E9-E11

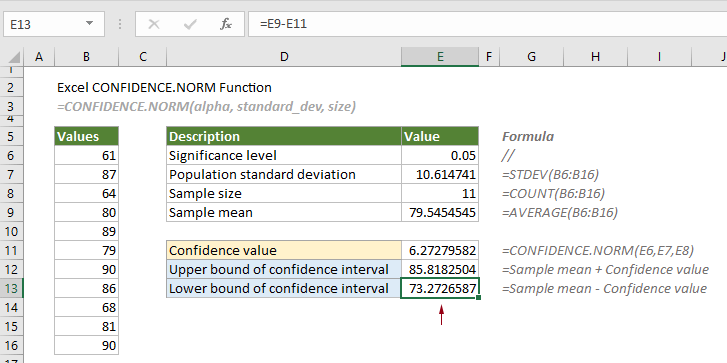
Therefore, the confidence level is equal to 85.8182504 to 73.2726587.


Related Functions

Excel CHISQ.INV function
The CHISQ.INV function calculates the inverse of the left-tailed probability of the chi-squared distribution.

Excel CHISQ.INV.RT function
The CHISQ.INV.RT function calculates the inverse of the right-tailed probability of the chi-squared distribution.

Excel CHISQ.TEST function
The CHISQ.TEST function calculates the chi-squared distribution of two provided data sets (the observed and expected frequencies.

Excel CONFIDENCE.T function
The CONFIDENCE.T function uses a student’s distribution to calculate the confidence interval for a population mean.


The Best Office Productivity Tools

Kutools for Excel - Helps You To Stand Out From Crowd

🤖 Kutools AI Aide: Revolutionize data analysis based on: Intelligent Execution   |  Generate Code  |  Create Custom Formulas  |  Analyze Data and Generate Charts  |  Invoke Kutools Functions
Popular Features: Find, Highlight or Identify Duplicates  |  Delete Blank Rows  |  Combine Columns or Cells without Losing Data  |  Round without Formula ...
Super VLookup: Multiple Criteria  |  Multiple Value  |  Across Multi-Sheets  |  Fuzzy Lookup...
Adv. Drop-down List: Easy Drop Down List  |  Dependent Drop Down List  |  Multi-select Drop Down List...
Column Manager: Add a Specific Number of Columns  |  Move Columns  |  Toggle Visibility Status of Hidden Columns  Compare Columns to Select Same & Different Cells ...
Featured Features: Grid Focus  |  Design View  |  Big Formula Bar  |  Workbook & Sheet Manager | Resource Library (Auto Text)  |  Date Picker  |  Combine Worksheets  |  Encrypt/Decrypt Cells  |  Send Emails by List  |  Super Filter  |  Special Filter (filter bold/italic/strikethrough...) ...
Top 15 Toolsets12 Text Tools (Add Text, Remove Characters ...)  |  50+ Chart Types (Gantt Chart ...)  |  40+ Practical Formulas (Calculate age based on birthday ...)  |  19 Insertion Tools (Insert QR Code, Insert Picture from Path ...)  |  12 Conversion Tools (Numbers to Words, Currency Conversion ...)  |  7 Merge & Split Tools (Advanced Combine Rows, Split Excel Cells ...)  |  ... and more

Kutools for Excel Boasts Over 300 Features, Ensuring That What You Need is Just A Click Away...

Description


Office Tab - Enable Tabbed Reading and Editing in Microsoft Office (include Excel)

  • One second to switch between dozens of open documents!
  • Reduce hundreds of mouse clicks for you every day, say goodbye to mouse hand.
  • Increases your productivity by 50% when viewing and editing multiple documents.
  • Brings Efficient Tabs to Office (include Excel), Just Like Chrome, Edge and Firefox.
Comments (0)
No ratings yet. Be the first to rate!
There are no comments posted here yet
Please leave your comments in English
Posting as Guest
×
Rate this post:
0   Characters
Suggested Locations