Excel FORECAST.LINEAR function
The FORECAST.LINEAR function predicts a future value based on existing values by using the linear regression.
Syntax
FORECAST.LINEAR(x, known_y's, known_x's)
Arguments
- x (required): The data point (x value) for which you want to predict a y value;
- known_y’s (required): The dependent array or range of data (y values)
- known_x’s (required): The independent array or range of data (x values)
Remarks

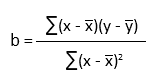
 and
and  are the averages of know_x’s and known_y’s.
Return value
It returns a numeric value.
Example
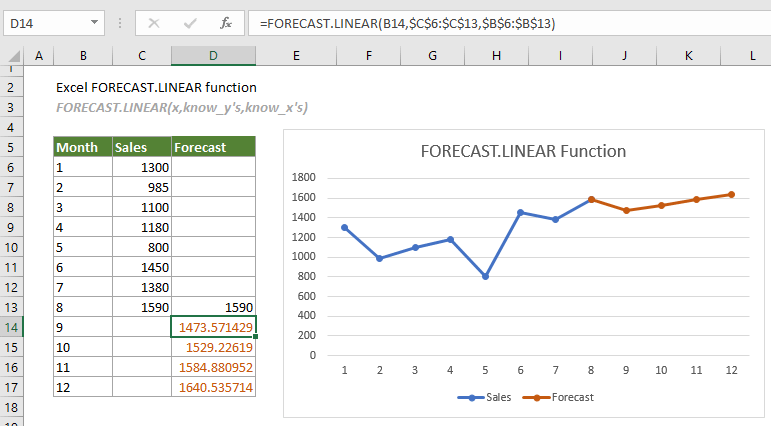
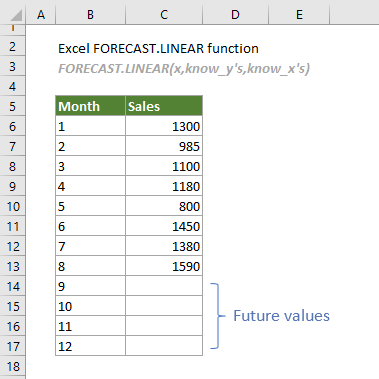
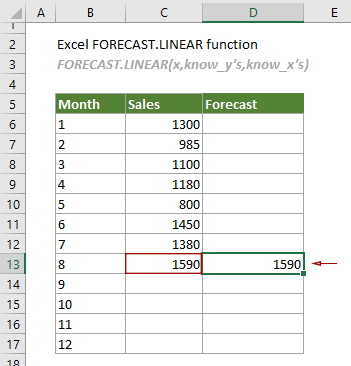
As shown in the table below, there is a list of monthly sales from January to August, to predict the future sales along the linear trend, you can try the FORECAST.LINEAR function as follows.
1. Create a helper column. In this case, I create a FORECASE column as shown in the screenshot below.
Tips: Creating a helper column helps to distinguish the predicted values from the actual values in a chart using different colors, which makes the chart more intuitive.
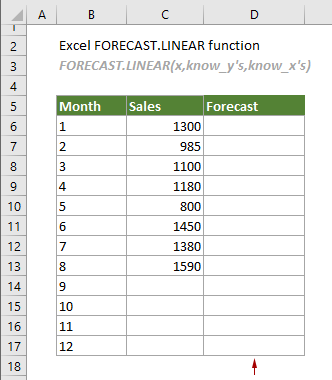
2. Find the cell containing the last sales (C13 in this case) in the Sales column, select a cell (D13) next to it in the helper column, and then enter a number that is the same as the last sales.
3. Select the cell D14, copy or enter the formula below and press the Enter key to get the result. Then select the result cell and drag its AutoFill Handle down to get other predicted values.
=FORECAST.LINEAR(B14,$C$6:$C$13,$B$6:$B$13)
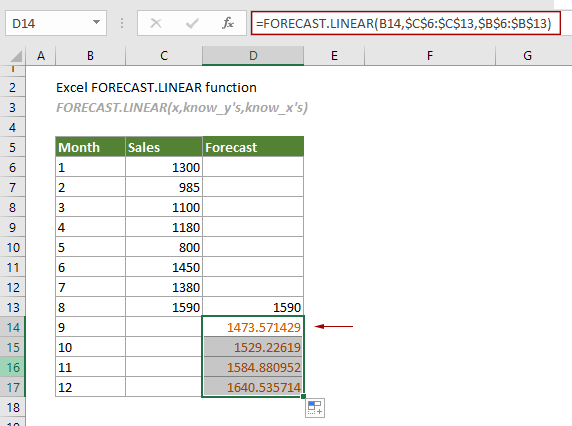
After getting all predicted values, you can create a forecast chart based on the table data according to your needs. See the screenshot below:
Related Functions
Excel FORECAST.ETS function
The FORECAST.ETS function uses the Exponential Smoothing (ETS) algorithm to predict a future value based on a series of existing values.
Excel FORECAST.ETS.CONFINT function
The FORECAST.ETS.CONFINT function calculates the confidence interval for the forecast value at the specified target date.
Excel FORECAST.ETS.SEASONALITY function
The FORECAST.ETS.SEASONALITY function returns the length of a seasonal pattern based on existing values and a timeline.
Excel FORECAST.ETS.STAT function
The FORECAST.ETS.STAT function returns a specified statistical value as a result of time series forecasting.
Excel FORECAST function
The FORECAST function predicts a future value based on existing values by using the linear regression.
The Best Office Productivity Tools
Kutools for Excel - Helps You To Stand Out From Crowd
Kutools for Excel Boasts Over 300 Features, Ensuring That What You Need is Just A Click Away...
Office Tab - Enable Tabbed Reading and Editing in Microsoft Office (include Excel)
- One second to switch between dozens of open documents!
- Reduce hundreds of mouse clicks for you every day, say goodbye to mouse hand.
- Increases your productivity by 50% when viewing and editing multiple documents.
- Brings Efficient Tabs to Office (include Excel), Just Like Chrome, Edge and Firefox.