Excel HYPGEOM.DIST Function
The HYPGEOM.DIST function returns the value of the hypergeometric distribution, which is the probability for a specified number of successes from a population sample. The hypergeometric distribution is used to calculate probabilities of a given number of successes in a sample without replacement from a finite population.

Syntax
=HYPGEOM.DIST (sample_s,number_sample,population_s,number_pop,cumulative)
Arguments
- Sample_s (required): The number of successes in the sample.
- Number_sample (required): The size of the sample.
- Population_s (required): The number of successes in the population.
- Number_pop (required): The size of the population.
- Cumulative (required): A logical value specifying the type of distribution to be calculated. It is either a TRUE or FALSE value.
If it is TRUE, HYPGEOM.DIST returns the cumulative distribution function, which calculates the probability of at most n successes from a specified number of trials.
If it is FALSE, HYPGEOM.DIST returns the probability density function, which calculates the probability of exactly n successes from a specified number of trials.
Return value
The HYPGEOM.DIST function returns a numeric value.
Function notes
- The HYPGEOM.DIST function was newly introduced In Excel 2010, so it is unavailable in earlier versions.
- The #VALUE! error value occurs if any of the supplied arguments is non-numeric.
- The #NUM! error value occurs if any of the below situation occurs:
- The supplied sample_s is < 0;
- The supplied number_sample < 0 or > number_pop;
- The supplied population_s < 0 or > number_pop;
- The supplied number_pop ≤ 0.
- Zero (0) will be returned when supplied sample_s is < (number_sample - number_population + population_s) value.
- The equation for the hypergeometric distribution is:
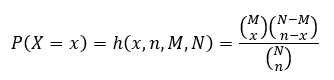
Where x means sample_s, n means number_sample, M means population_s, and N means number_pop.

Examples
Example One: Cumulative Distribution Function
In this case, you have a bag, inside which are 12 red balls and 8 blue balls. Now if you reach in the bag and pick 6 balls from it, what is the possibility of getting at most 3 blue balls?
Please copy the formula below into cell H5, then press the Enter key to get the result.
=HYPGEOM.DIST(B5,C5,D5,E5,F5)

Note: We can also directly input values in the formula. The formula in cell H5 can be changed to:
=HYPGEOM.DIST(3,6,8,20,TRUE)
Example Two: Probability Density Function
Like the situation above, you also have a bag, inside which are 12 red balls and 8 blue balls. Now if you reach in the bag and pick 6 balls from it, what is the possibility of getting exactly 3 blue balls?
Please copy the formula below into cell H6, then press the Enter key to get the result.
=HYPGEOM.DIST(B6,C6,D6,E6,F6)

Note: We can also directly input values in the formula. The formula in cell H6 can be changed to:
=HYPGEOM.DIST(3,6,8,20,FALSE)
Relative Functions:
Excel EVEN Function
The EVEN function rounds numbers away from zero to the nearest even integer.
Excel EXP Function
The EXP function returns the result of the constant e raised to the nth power.
The Best Office Productivity Tools
Kutools for Excel - Helps You To Stand Out From Crowd
Kutools for Excel Boasts Over 300 Features, Ensuring That What You Need is Just A Click Away...
Office Tab - Enable Tabbed Reading and Editing in Microsoft Office (include Excel)
- One second to switch between dozens of open documents!
- Reduce hundreds of mouse clicks for you every day, say goodbye to mouse hand.
- Increases your productivity by 50% when viewing and editing multiple documents.
- Brings Efficient Tabs to Office (include Excel), Just Like Chrome, Edge and Firefox.