Excel LOGEST Function
The LOGEST function returns an exponential curve that best fits a supplied set of y- and x- values and returns an array of values that describes the curve.
Syntax
=LOGEST(known_y’s,[known_x’s],[const],[stats])
Arguments
- Known_y’s (required): A set of known y-values.
- Known_x’s (optional): A set of known x-values. If provided, the data range of known_x's should have the same length as the data range of known_y’s. If omitted, it uses{1,2,3,...} as the known_y’s parameter.
- Const (optional): A logical value specifying whether the constant 'b', in the equation y = b * m^x, should be forced to be equal to the value 1. It is either a TRUE or FALSE value.
If const is TRUE or omitted, the constant b is calculated normally.
If const is FALSE, the constant b is set to 1 and the equation becomes y = m^x. - Stats (optional): A logical value specifying whether additional regression statistics should be returned. It is either a TRUE or FALSE value.
If stats is FALSE or omitted, LOGEST returns only the m-coefficients and the constant b.
If stats is TRUE, LOGEST returns the additional regression statistics, so the returned array is {mn,mn-1,...,m1,b;sen,sen-1,...,se1,seb;r 2,sey; F,df;ssreg,ssresid}.
Return value
The LOGEST function returns a numeric value.
Function notes
- The LOGEST function returns an array of results and must be entered as an array formula. Dynamic array formulas are available in Excel 365, Excel 2021, and Excel for the web, meaning no need to press CTRL+SHIFT+ENTER to make the formula dynamic. For users of Excel 2019 and earlier, remember to enter the formula via CTRL+SHIFT+ENTER so the multiple results can be returned in an array.
- The #REF! error value occurs if the array of known_x’s is not the same length as the array of known_y’s.
- The #VALUE! error value occurs if any of the below situation occurs:
- Any of the values in the supplied known_x’s or known_y’s arrays are non-numeric;
- Either the const or stats arguments cannot be evaluated to TRUE or FALSE.
- The equation for the curve is y = b*m^x or y = (b*(m1^x1)*(m2^x2)*_).
If there are multiple x-values, where the dependent y-value is a function of the independent x-values. The m-values are bases corresponding to each exponent x value, and b is a constant value. Note that y, x, and m can be vectors.
The array that LOGEST returns is {mn,mn-1,...,m1,b}. - The more a plot of your data resembles an exponential curve, the better the calculated line will fit your data. Both LINEST and LOGEST return an array of values that describes a relationship among the values, but LINEST fits a straight line to your data, whereas LOGEST fits an exponential curve.
- When you have only one independent x-variable, you can obtain y-intercept (b) values directly by using the following formula:
Y-intercept (b): INDEX (LOGEST (known_y's,known_x's),2)
You can use the y = b*m^x equation to predict future values of y, but the GROWTH Function does the same. - When entering an array constant such as known_x's as an argument, use commas to separate values in the same row and semicolons to separate rows. Separator characters may be different depending on your regional settings.
- You should note that the y-values predicted by the regression equation may not be valid if they are outside the range of y-values you used to determine the equation.
Example
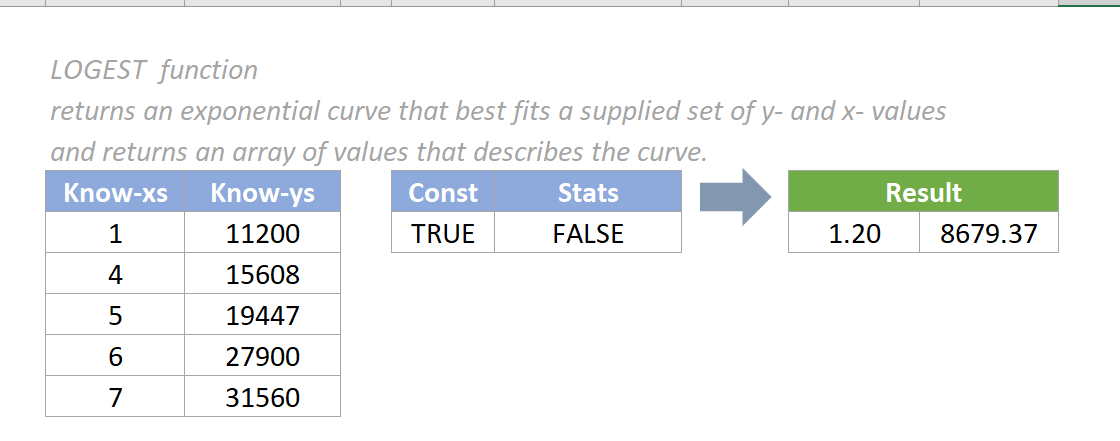
As the below screenshot shows, there is a table of data with x and y values where x is the independent variable and y is the dependent variable. To use LOGEST to fit a curve to the data, please do as follows:
1. Select the cells to output the results, such as H6 and I6 in this case. Copy the formula below into the Formula Bar, then press the CTRL+SHIFT+ENTER keys to get the results.
=LOGEST(C6:C10,B6:B10,E6,F6)
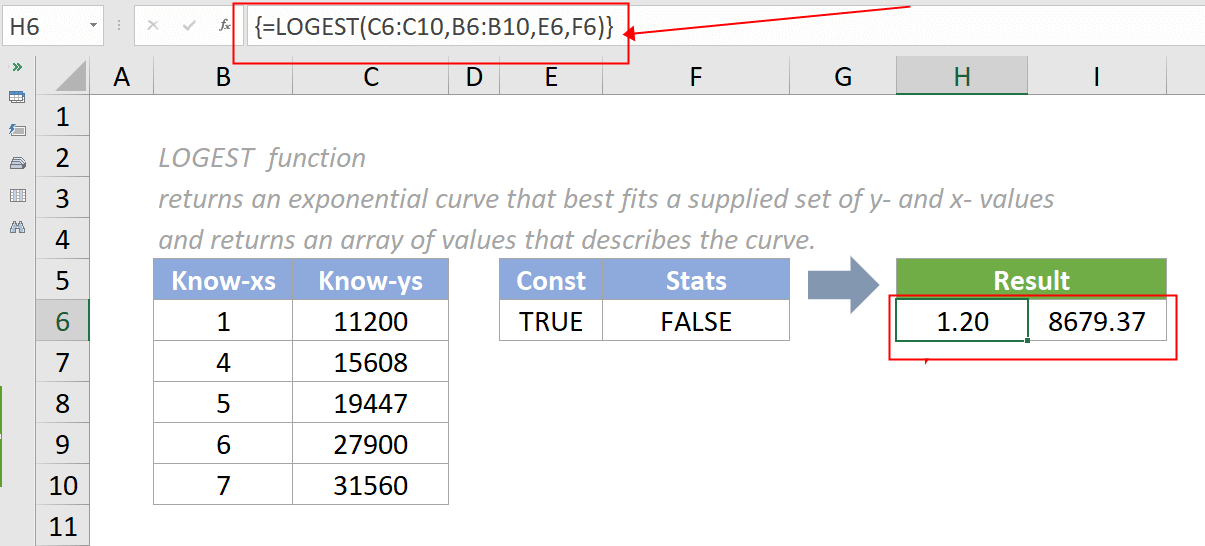
Note: The result cell H6 contains the m value and result cell I6 contains the b value of the curve. The equation of the exponential curve for a single x variable is: y = b*m^x, where b = y-intercept of the curve, and m = the slope parameter of the curve.
Relative Functions:
Excel EVEN Function
The EVEN function rounds numbers away from zero to the nearest even integer.
Excel EXP Function
The EXP function returns the result of the constant e raised to the nth power.
The Best Office Productivity Tools
Kutools for Excel - Helps You To Stand Out From Crowd
Kutools for Excel Boasts Over 300 Features, Ensuring That What You Need is Just A Click Away...
Office Tab - Enable Tabbed Reading and Editing in Microsoft Office (include Excel)
- One second to switch between dozens of open documents!
- Reduce hundreds of mouse clicks for you every day, say goodbye to mouse hand.
- Increases your productivity by 50% when viewing and editing multiple documents.
- Brings Efficient Tabs to Office (include Excel), Just Like Chrome, Edge and Firefox.