Excel PROB Function

Description
The Excel PROB function returns the probability that values in a range are between two limits, which is frequently used to estimate business losses or used by a risk manager to analyze the financial probability.
Formula syntax
Arguments
|
Returns
PROB function returns a numeric value.
Remarks
1. Errors appear when
- Any value in prob_range ≤ 0 or any value in prob_range > 1, PROB function returns the #NUM error value.
- The sum of values in prob_range is not equal to 1, PROB function returns the #NUM error value.
- X_range and prob_range have different numbers of data points, PROB function return the #N/A error value.
2. if upper_limit is omitted, PROB function returns the probability that values in x_range are equal to lower_limit.
Version
Excel 2007 and later versions
Usage and Examples
Basic usage
Supposing a table that contains the scores, the chances of getting each score, and the probabilities of getting each score as below screenshot shown: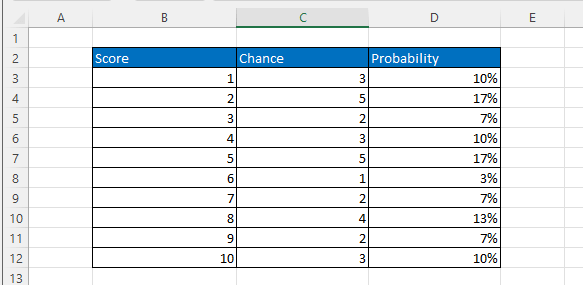
To get the probability of getting a score higher than 8 based on the table, please use the PROB function as below:
=PROB($B$3:$B$12,$D$3:$D$12,8,10)
Press Enter key to get the probability.
Other Functions:
Excel POISSON Function
The Excel POISSON function returns the Poisson distribution which is used to predict the number of events occurring over a specific time.
Excel FDIST Function
The Excel FDIST Function returns the (right-tailed) F probability distribution which is usually used to measure the degree of diversity between two data sets.
Excel EXPON.DIST Function
EXPON.DIST function used in Excel 2010, returns the exponential distribution based on the given x value and the parameter of the distribution.
Excel F.DIST Function
The Excel F.DIST function returns the F probability distribution which is usually used to measure the degree of diversity between two data sets.
The Best Office Productivity Tools
Kutools for Excel - Helps You To Stand Out From Crowd
Kutools for Excel Boasts Over 300 Features, Ensuring That What You Need is Just A Click Away...
Office Tab - Enable Tabbed Reading and Editing in Microsoft Office (include Excel)
- One second to switch between dozens of open documents!
- Reduce hundreds of mouse clicks for you every day, say goodbye to mouse hand.
- Increases your productivity by 50% when viewing and editing multiple documents.
- Brings Efficient Tabs to Office (include Excel), Just Like Chrome, Edge and Firefox.