Excel TREND Function
The TREND function returns the linear trend line through a given set of dependent y-values and, optionally, a set of independent x-values. The function then extends the linear trendline to predict dependent y-values for a further supplied set of new x-values.
Syntax
=TREND(known_y's, , known_x's, new_x's, const)
Arguments
- known_y's, (required): The set of dependent y-values you already know.
- known_x's (optional): One or more sets of known independent x-values.
- If only one x variable is used, known_y's and known_x's can be ranges of any shape but with equal dimensions.
- If several x variables are used, known_y's must be a vector (one column or one row).
- If omitted, known_x's is assumed to be the array of serial numbers {1,2,3,...} with the same size as known_y's.
- new_x's (optional): New x-values for which you want to calculate the trend and return the corresponding y-values.
- new_x's must have the same number of columns or rows as known_x's does;
- If omitted, new_x's is assumed to be the same as known_x's.
- const (optional): A logical value specifying how the constant b in the equation y = mx + b should be calculated:
- TRUE or omitted, b is calculated normally;
- FALSE, the constant b is forced to 0, and the m-values are adjusted so that y = mx.
Return Value
The TREND function predicts values along a linear trend.
Function Notes
- If you are using the Excel versions that are prior to Microsoft 365, you should select the output range first, then enter the TREND formula in the top-left-cell of the output range, and then press Ctrl + Shift + Enter to apply the function. For the users of Microsoft 365 and newer versions of Excel, you can just enter the formula the top-left-cell, and then press Enter.
- The existing data in the supplied known_y's and known_x's need to be linear data that, for the given x-values, the y-values should fit the linear curve y = mx + b. Otherwise, the output or the predicted values may be inaccurate.
- TREND returns the #REF! error if known_x's and known_y's are of different lengths.
- TREND returns the #VALUE! error if:
- Any of the values in the supplied nown_y's, known_x's or new_x's are non-numeric;
- The supplied const is not recognized as a logical value.
- The TREND function finds the line that best fits your data by using the least squares method. The equation for the line is as follows.
- For one range of x-values:
- y = mx + b
- For multiple ranges of x-values:
- y = m1x1 + m2x2 + ... + b
- Where:
- y - the dependent variable to calculate.
- x - the independent variable to use to calculate y.
- m - the slope that shows how steep the line is.
- b - the constant (the intercept that equals to the value of y when x = 0).
- For information about how Microsoft Excel fits a line to data, see LINEST function.
Example
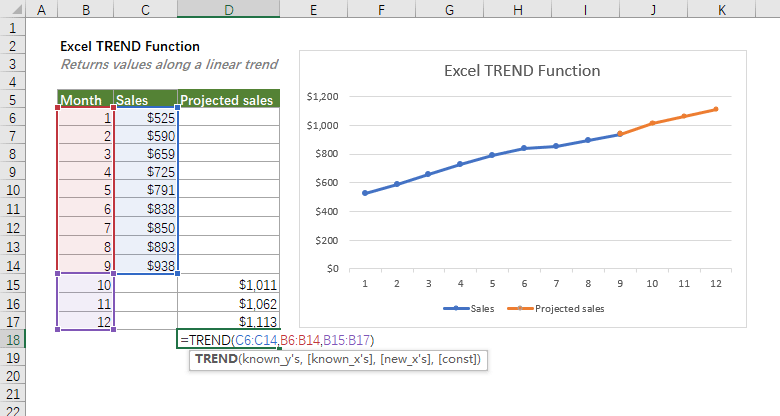
Supposing you have a sales table of the first nine months of the year, to predict the sales of the next three months, please enter the formula below in the top cell, and press Enter to get the results if you are using Microsoft 365 or newer versions of Excel. Otherwise, select the output range first, then enter the formula below in the top cell of the output range, and then press Ctrl + Shift + Enter.
=TREND(C6:C14,B6:B14,B15:B17)

Related functions
The FORECAST function predicts a future value based on existing values by using the linear regression.
The Excel LINEST function returns the statistic for a best fit straight line based on the supplied set of x value and y value by using the “least squares” method. The function returns an array of constant values.
The LOGEST function returns an exponential curve that best fits a supplied set of y- and x- values and returns an array of values that describes the curve.
The GROWTH function returns the predicted exponential GROWTH based on a given set of data. By using the existing x-values and y-values, the GROWTH function calculates the predicted y-values for a series of new x-values. In financial terms, companies can use the GROWTH function to predict the revenues of the coming years.
The Best Office Productivity Tools
Kutools for Excel - Helps You To Stand Out From Crowd
Kutools for Excel Boasts Over 300 Features, Ensuring That What You Need is Just A Click Away...
Office Tab - Enable Tabbed Reading and Editing in Microsoft Office (include Excel)
- One second to switch between dozens of open documents!
- Reduce hundreds of mouse clicks for you every day, say goodbye to mouse hand.
- Increases your productivity by 50% when viewing and editing multiple documents.
- Brings Efficient Tabs to Office (include Excel), Just Like Chrome, Edge and Firefox.