Excel VAR.P function
The VAR.P function calculates the variance based on the entire population.
Excel variance functions
The following table lists all Excel variance functions and their usage notes, which can help you choose the one that best suits your needs.
| Name | Data type | Text and logicals in references |
| VAR | Sample | Ignored |
| VAR.S | Sample | Ignored |
| VARA | Sample | Evaluated |
| VARP | Population | Ignore |
| VAR.P | Population | Ignored |
| VARPA | Population | Evaluated |
Syntax
VAR.P(number1, [number2], ...)
Arguments
- Number1 (required): The first number or reference used in the calculation.
- Number2, ... (required): The second and more numbers or references used in the calculation.
Remarks
 is the average of the sample.
Return value
It returns a numeric value.
Example
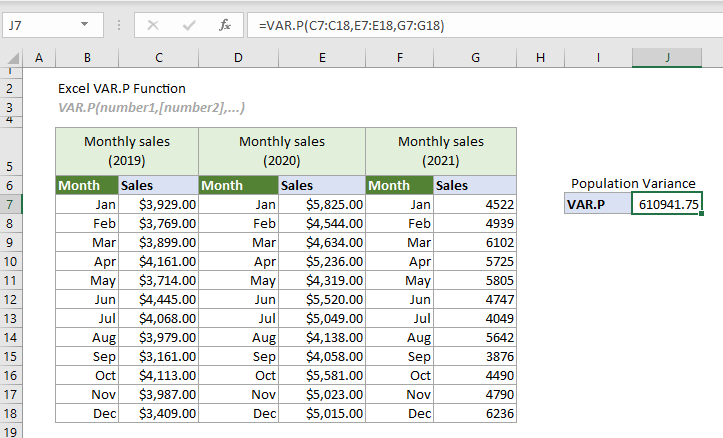
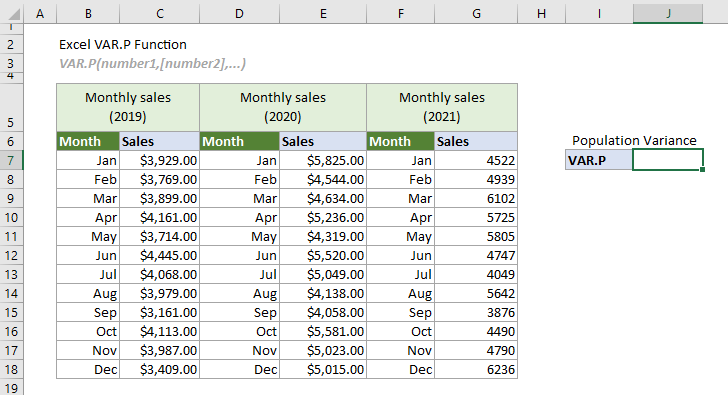
The following table lists the monthly sales for 2019, 2020 and 2021 separately. Assuming that the monthly sales for these three years are the entire population. To calculate the variance based on this entire population, you can apply the VAR.P function as follows to get it done.
Select a cell (says J7 in this case), enter the formula below and press the Enter key to get the result.
=VAR.P(C7:C18,E7:E18,G7:G18)
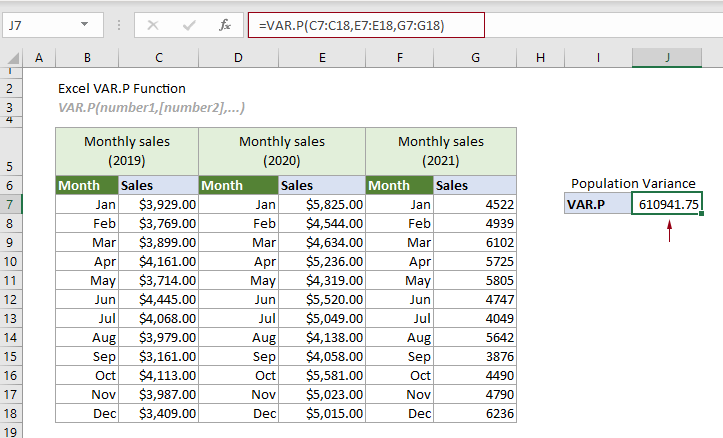
Note: Arguments in the formula above are supplied as three cell ranges. However, you can also input the numbers directly in the function as individual numbers or number arrays.
Related Functions
Excel VARA function
The VARA function calculates the variance based on a given sample.
Excel VAR function
The VAR function calculates the variance based on a given sample.
Excel VAR.S function
The VAR.S function calculates the variance based on a given sample.
Excel VARP function
The VARP function calculates the variance based on the entire population.
Excel VARPA function
The VARPA function calculates the variance based on the entire population.
The Best Office Productivity Tools
Kutools for Excel - Helps You To Stand Out From Crowd
Kutools for Excel Boasts Over 300 Features, Ensuring That What You Need is Just A Click Away...
Office Tab - Enable Tabbed Reading and Editing in Microsoft Office (include Excel)
- One second to switch between dozens of open documents!
- Reduce hundreds of mouse clicks for you every day, say goodbye to mouse hand.
- Increases your productivity by 50% when viewing and editing multiple documents.
- Brings Efficient Tabs to Office (include Excel), Just Like Chrome, Edge and Firefox.