Excel ZTEST Function
Description
The Excel ZTEST function returns the one-tailed P-value of a z-test which is useful for various analyses. Based on the given hypothesized population mean, x, ZTEST function returns the probability that the sample mean would be greater than the observed sample mean.
Note: This function has been replaced with one or more functions that may provide improved accuracy after Excel 2010 version. This function is still can be available but considering it may be not available in the future, you should better study to use the new function from now.
Formula syntax
Arguments
|
Returns
ZTEST function returns a numeric value.
Remarks
1. ZTEST represents the probability that the sample mean would be greater than the observed mean AVERAGE(array), when the underlying population mean is μ0. From the symmetry of the normal distribution, if AVERAGE(array) < x, ZTEST returns a value greater than 0.5.
2. ZTEST is calculated as follows
- when sigma is known:

- when sigma is omitted:
 Where x is the sample mean AVERAGE(array), and n is COUNT(array), and s is the sample standard deviation STDEV(array).
Errors
1. #VALUE! error – Occurs when the x or sigma is not a numeric value.
2. #NUM! error – Occurs when sigma = 0.
3. #N/A! error – Occurs when array is empty.
4. #DIV/0! error – Occurs when array contains only one value, or sigma is omitted and the standard deviation of the supplied array is 0.
Version
Excel 2007 and earlier versions
Usage and Examples
Basic usage
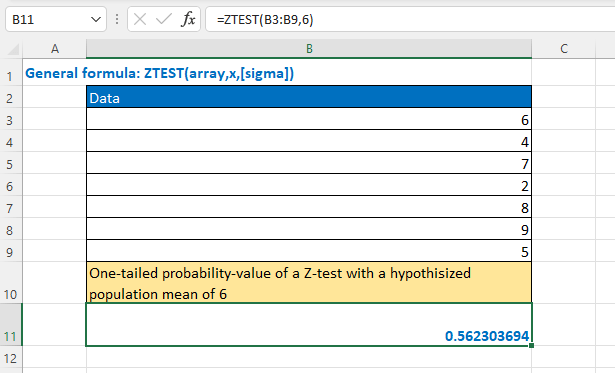
To get the one-tailed probability value of a z-test for the data in range B3:B9 with a hypothesized population mean of 6, please use the formula as this:
=ZTEST(B3:B9,6)
Press Enter key to get the result.
Other Functions:
Excel POISSON Function
The Excel POISSON function returns the Poisson distribution which is used to predict the number of events occurring over a specific time.
Excel WEIBULL Function
The Excel WEIBULL function returns the Weibull probability density function or Weibull cumulative distribution for a supplied set of parameters.
Excel Z.TEST Function
The Excel Z.TEST function (2010) returns the one-tailed P-value of a z-test which is useful for various analyses.
Excel F.DIST Function
The Excel F.DIST function returns the F probability distribution which is usually used to measure the degree of diversity between two data sets.
The Best Office Productivity Tools
Kutools for Excel - Helps You To Stand Out From Crowd
Kutools for Excel Boasts Over 300 Features, Ensuring That What You Need is Just A Click Away...
Office Tab - Enable Tabbed Reading and Editing in Microsoft Office (include Excel)
- One second to switch between dozens of open documents!
- Reduce hundreds of mouse clicks for you every day, say goodbye to mouse hand.
- Increases your productivity by 50% when viewing and editing multiple documents.
- Brings Efficient Tabs to Office (include Excel), Just Like Chrome, Edge and Firefox.