Easily make a horizontal dumbbell chart in Excel
Kutools for Excel
Boosts Excel With 300+
Powerful Features
An Excel horizontal dumbbell chart is good for comparing two points of data year on year as below screenshot shown. However, in Excel, there is no built-in dumbbell chart for quickly creation, but with Kutools for Excel’s Charts tools, you can create the dumbbell chart with 3 steps by its Dumbbell Plot Chart utility.
Usages:
1. Click Kutools > Charts > Data Distribution > Dumbbell Plot Chart to enable the feature.
2. Then in the Dumbbell Plot Chart dialog, configure as follows:
(1) In Axis Labels box, click ![]() to choose the label range which will be displayed in Y axis (including column header);
to choose the label range which will be displayed in Y axis (including column header);
(2) In Data Series 1 and Data Series 2 boxes, click ![]() button to separately select the data which will be compared (including column headers).
button to separately select the data which will be compared (including column headers).
Tips: If you do not want to display the series name based on the data, you can choose the data range excluding the column headers, then the series names will be the default names: Series 1 and Series 2.
3. Click Ok. Then a dumbbell plot chart is created.
Notes
1. You can click Example button in the Dumbbell Plot Chart dialog to realize how to use this utility.
2. The chart changes as the data changes.
3. If you want to resize or change the color of dots, you can do as these:
(1) Double click any one of the dots to display the Format Data Series pane.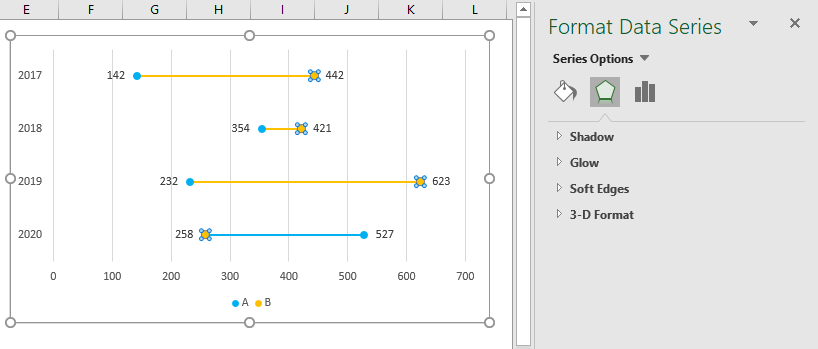
(2) Click the Fill & Line tab, then go to the Marker part. In this part, you can change the plots’ size and filled color.
4. The Dumbbell Plot Chart has been enhanced to color the bars between two bells based on the bigger bell values, so that you can quickly identify the difference is positive or negative between the two bell values. 
Productivity Tools Recommended
Office Tab: Use handy tabs in Microsoft Office, just like Chrome, Firefox, and the new Edge browser. Easily switch between documents with tabs — no more cluttered windows. Know more...
Kutools for Outlook: Kutools for Outlook offers 100+ powerful features for Microsoft Outlook 2010–2024 (and later versions), as well as Microsoft 365, helping you simplify email management and boost productivity. Know more...
Kutools for Excel
Kutools for Excel offers 300+ advanced features to streamline your work in Excel 2010 – 2024 and Microsoft 365. The feature above is just one of many time-saving tools included.
