Easily create a dynamic pie of pie chart in Excel
Kutools for Excel
Boosts Excel With 300+
Powerful Features
In Excel, you can use the built-in Pie of Pie chart to show proportions of a whole, but it supports only one series at a time. Here, with the Dynamic Pie Chart feature of Kutools for Excel, you can easily create a chart with two pies that not only shows proportions of the sum of each row or column in the selected range, but also proportions of the data in a specified row or column at the same time. In addition, you can dynamically change the displayed data by changing the selection from the drop-down list.
Create a dynamic pie of pie chart in Excel
Just need a few clicks, you can create a dynamic pie of pie chart in Excel with this feature. Please follow the steps below to get it done.
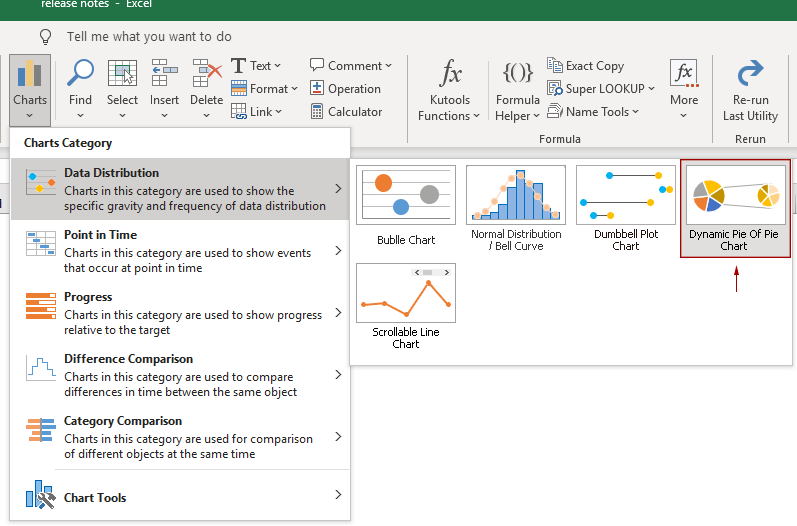
1. Click Kutools > Charts > Data Distribution > Dynamic Pie Of Pie Chart to enable this feature.
2. In the Dynamic Pie Of Pie Chart dialog box, you need to do the following settings.

Tips:
Then a dynamic pie of pie chart is created as shown in the demo below:
Notes:


Productivity Tools Recommended
Office Tab: Use handy tabs in Microsoft Office, just like Chrome, Firefox, and the new Edge browser. Easily switch between documents with tabs — no more cluttered windows. Know more...
Kutools for Outlook: Kutools for Outlook offers 100+ powerful features for Microsoft Outlook 2010–2024 (and later versions), as well as Microsoft 365, helping you simplify email management and boost productivity. Know more...
Kutools for Excel
Kutools for Excel offers 300+ advanced features to streamline your work in Excel 2010 – 2024 and Microsoft 365. The feature above is just one of many time-saving tools included.
