Easily create a matrix bubble chart in Excel
Kutools for Excel
Boosts Excel With 300+
Powerful Features
Matrix bubble chart is often used for displaying data with more data series in Excel. If you want to create a matrix bubble chart in Excel, here highly recommend the Matrix Bubble Chart utility of Kutools for Excel. With this feature, a matric bubble chart can be created with several clicks only.
Easily create a matrix bubble chart in Excel
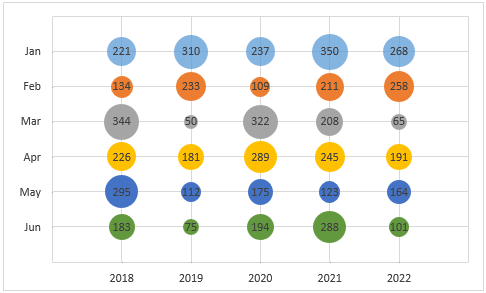
Supposing you want to create a matrix bubble chart based on the data as the below screenshot shown, please do as follows to create a matrix bubble chart in Excel.

1. Click Kutools > Charts > Difference Comparison > Matrix Bubble Chart.
Tips: You also can select the data range in advance and then enable the feature.

2. In the popping up Matrix Bubble Chart dialog box, please configure as follows.
Note: If you have selected the data range in step 1, the data range will be displayed in the Data range box automatically.

Notes:
Now the matrix bubble chart is created in current worksheet.
Note: When creating matrix bubble chart in Excel 2007 and 2010, the x and y-axis values in the chart will not dynamically change with the cell values.
Tips:
Change the bubble size
Normally, the bubble size is scaled to 50%. If you want to change the bubble size, please do as follows.
1. Right click on any of the bubbles in the chart, and then select Format Data Labels from the context menu.
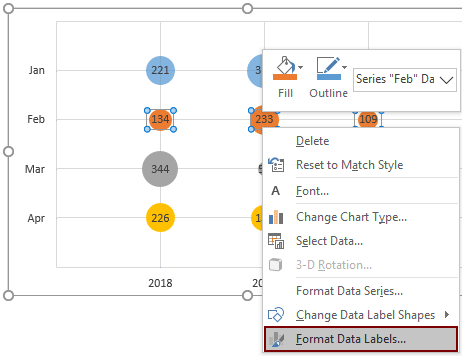
2. In the opening Format Data Series pane, enter the new bubble size into the Scale bubble size to box to meet your need.

Productivity Tools Recommended
Office Tab: Use handy tabs in Microsoft Office, just like Chrome, Firefox, and the new Edge browser. Easily switch between documents with tabs — no more cluttered windows. Know more...
Kutools for Outlook: Kutools for Outlook offers 100+ powerful features for Microsoft Outlook 2010–2024 (and later versions), as well as Microsoft 365, helping you simplify email management and boost productivity. Know more...
Kutools for Excel
Kutools for Excel offers 300+ advanced features to streamline your work in Excel 2010 – 2024 and Microsoft 365. The feature above is just one of many time-saving tools included.
