Move x axis labels to bottom of chart with only one click
Kutools for Excel
Boosts Excel With 300+
Powerful Features
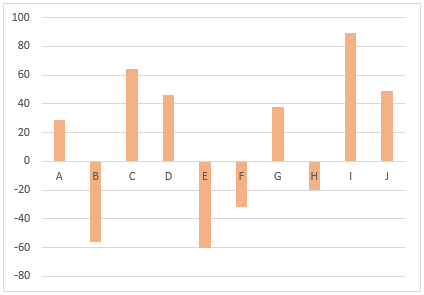
If you create a column or line chart with both positive and negative values, the x axis labels will be located on the zero line in the middle of chart, for reading the data more intuitive and easily, you should move the x axis labels to bottom of the chart. With Kutools for Excel’s Move X-axis to Negative/Zero/Bottom utility, you can solve this job with only one click in Excel.
Move x axis labels to bottom of chart in Excel
Move x axis labels to bottom of chart in Excel
For moving the x axis labels under the negative numbers at bottom of the chart, please do as this:
1. Click to select the chart that you want to move the x axis labels, and then click Kutools > Charts > Chart Tools > Move X-axis to Negative/Zero/Bottom, see screenshot:

2. And then, a prompt box is popped out to tell you the operation has been done.
3. Then, click OK button to close the prompt box, and the x axis labels have been moved to the bottom of the chart, see screenshots:
 |  |
Productivity Tools Recommended
Office Tab: Use handy tabs in Microsoft Office, just like Chrome, Firefox, and the new Edge browser. Easily switch between documents with tabs — no more cluttered windows. Know more...
Kutools for Outlook: Kutools for Outlook offers 100+ powerful features for Microsoft Outlook 2010–2024 (and later versions), as well as Microsoft 365, helping you simplify email management and boost productivity. Know more...
Kutools for Excel
Kutools for Excel offers 300+ advanced features to streamline your work in Excel 2010 – 2024 and Microsoft 365. The feature above is just one of many time-saving tools included.
