0
Undo
Votes
Good news! Kutools for Excel 23.00 is coming. This version brings 18 excellent chart templates, 7 amazing chart tools, and 2 other new handy features, accompanying with dozens of feature improvements! You can upgrade to or have a free trial of this version by downloading Kutools for Excel 23.00.
Tip: full function & feature, free trial in 30 days! If the 2-year free upgrade support period is not expired, you are entitled to free upgrade this version.
New Features
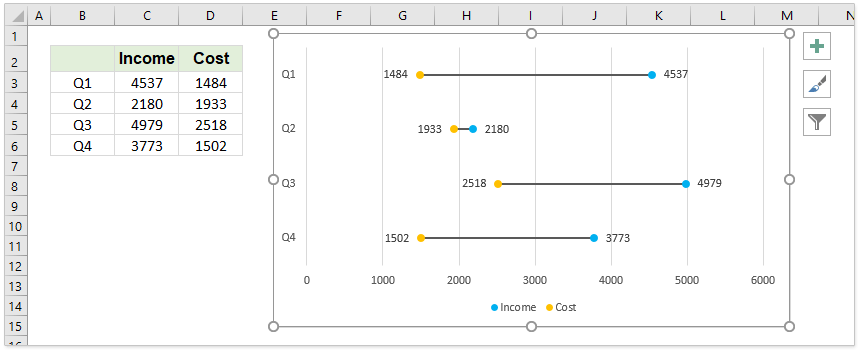
1.Dumbbell Plot Chart
The Dumbbell Plot chart can be used to compare two sets of data, and show the differences between them with lines in a chart.
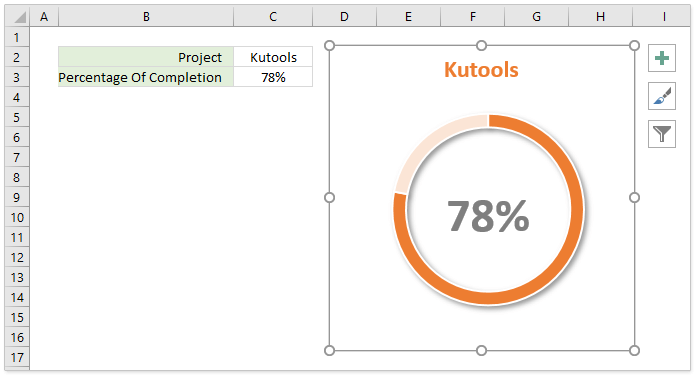
2.Progress Ring Chart
This Progress Ring Chart is commonly used to show the completion percentage of a project, with showing the completion percentage in the middle of doughnut.
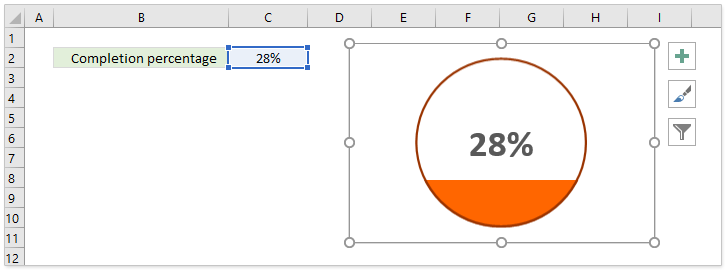
3.Percentage Ball Chart
The Percentage Ball Chart is commonly used to show the percentage of something occupied or remaining, or the completion percentage of a project. This chart supports to change border color, background color, and foreground color of the ball.
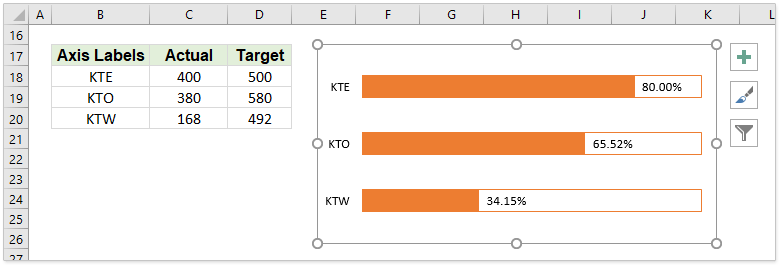
4.Progress Bar Chart
Comparing with above Progress Ring Chart or Percentage Ball Chart can only show the completion percentage of one project, the Progress Bar Chart can show the completion percentages of multiple projects in one chart.
The Progress Bar Chart can create a chart based on the given completion percentage.
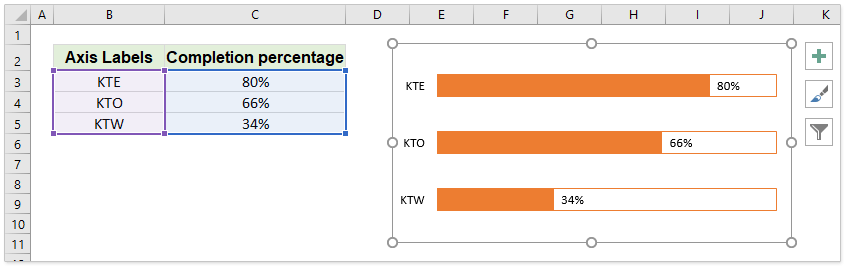
It also supports to create a chart based on the given actual and target values without figuring out the completion percentages in advance.
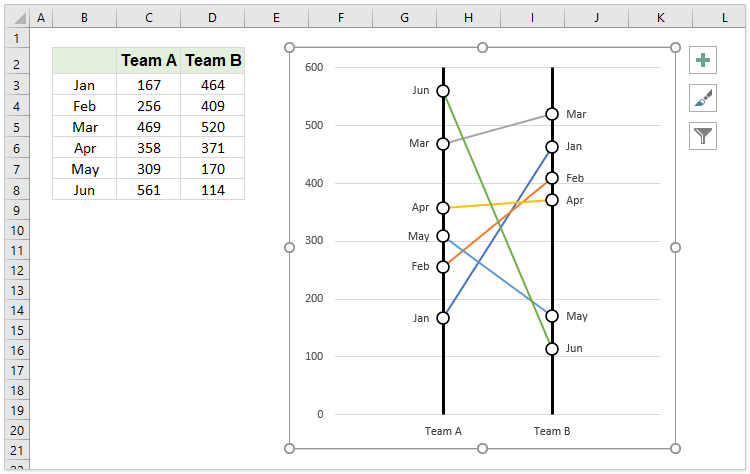
5.Slope Chart
You can easily create a Slope Chart in Excel to visually show the difference between two categories at two times.
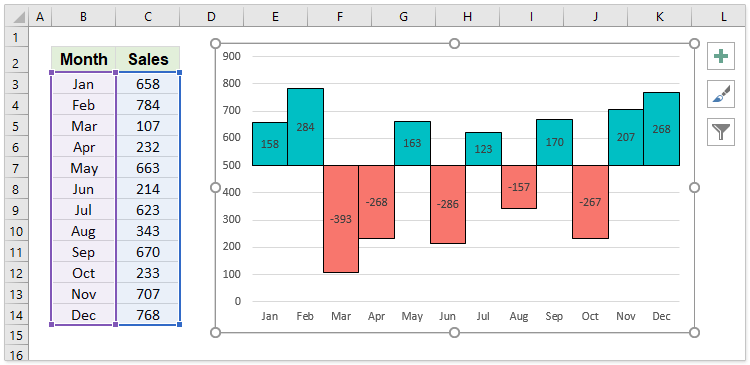
6.Threshold Value Chart
The Threshold Value Chart compares the data points with a given threshold value, and show the differences between data points and the threshold value by column direction, column height, and color.
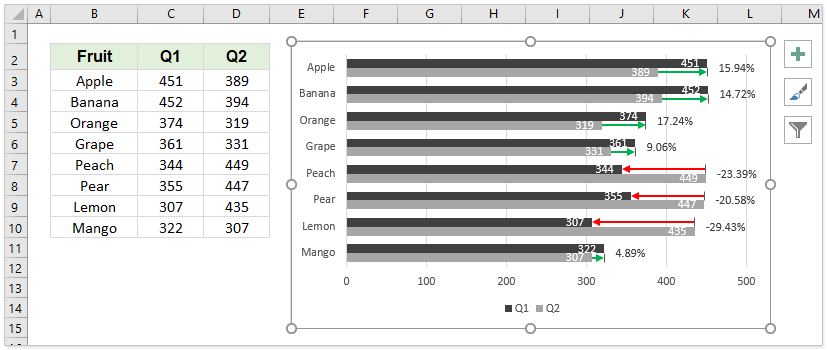
7.Difference Arrow Chart
This Different Arrow Chart is similar as a clustered column or bar charts, but add arrows and percentages to show the differences between two sets of data.
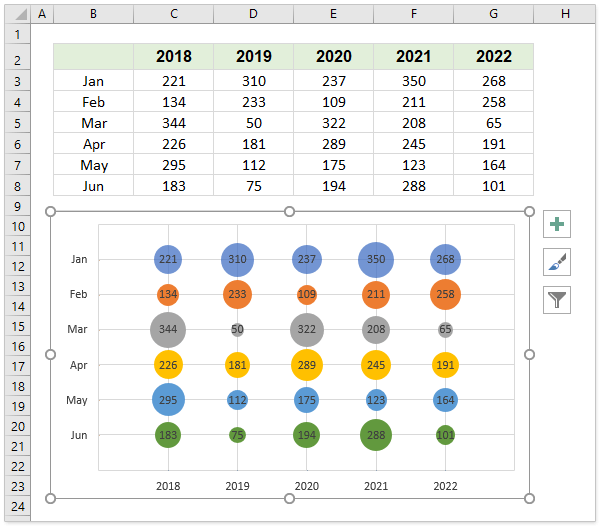
8.Matrix Bubble Chart
This feature helps to create a Matrix Bubble Chart with only several clicks in Excel. The matrix bubble chart represents data points by bubbles in a matrix, which is fit to compare multiple sets of data horizontally and vertically.
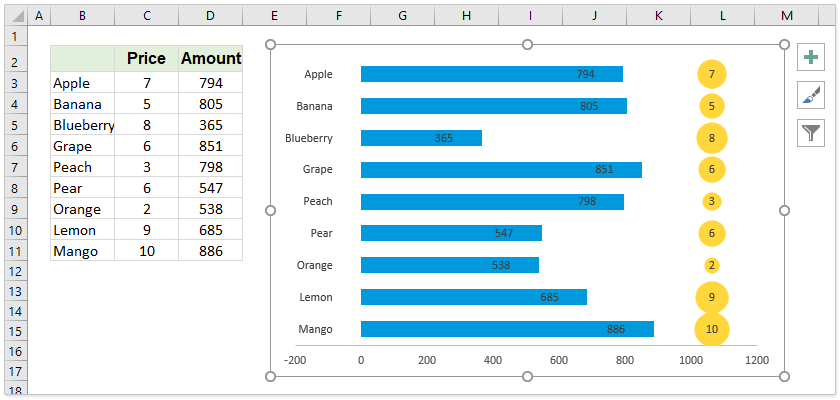
9.Bar with Bubbles Chart
A general clustered bar chart can only show a set of data. The Bar with Bubbles Chart enhances the bar chart, and helps us show two sets of data horizontally: use bars to show one set of data in left side, and use bubbles to show the other set of data in right side.
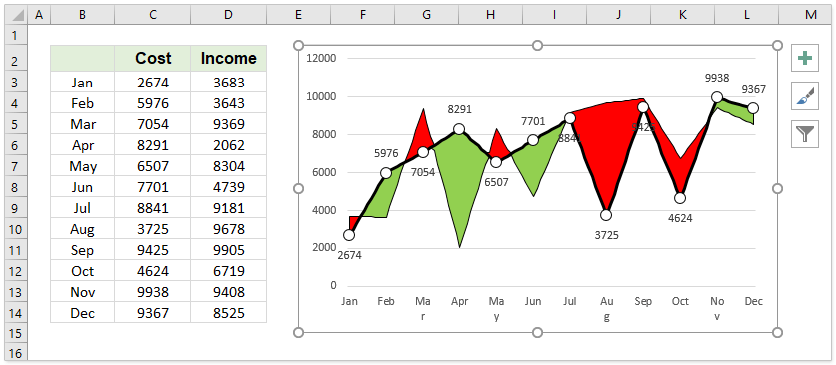
10.Difference Area Chart
The Difference Area Chart draws two lines for two sets of data, and use the filled room between the two lines to show the differences between two sets of data.
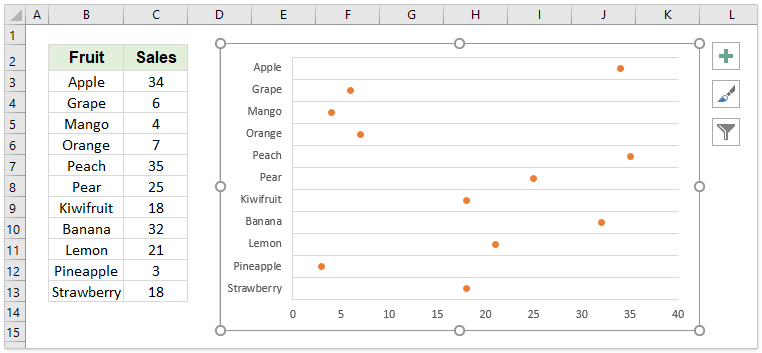
11.Dot Chart
The Dot Chart uses markers to show data, which looks like the scatter chart. But this chart assigns both X and Y axes with two sets of data.
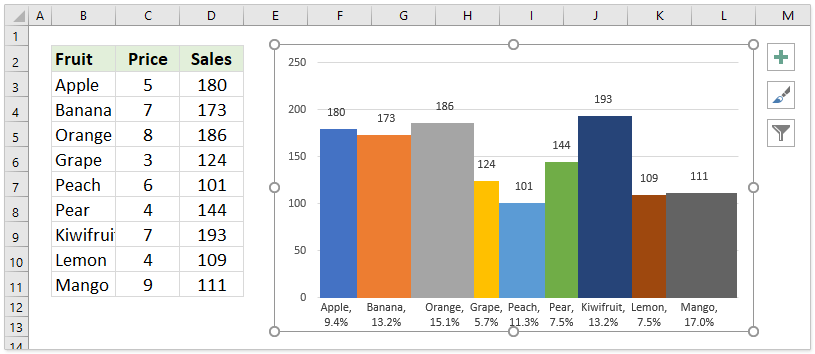
12.Variable Width Column Chart
Different from normal column showing one-dimension data by column heights, the Variable Width Column Chart can show two sets of values across two dimensions by both column widths and column heights.
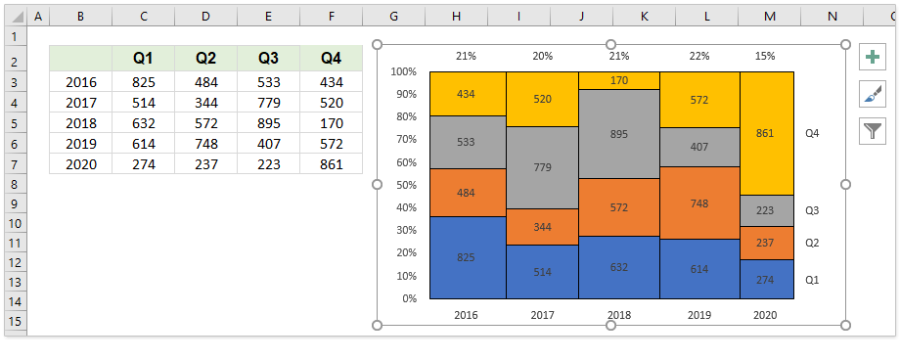
13.Marimekko Chart
The Marimekko Chart compounds multiple stacked columns in a chart, and shows all sets of values across three dimensions.
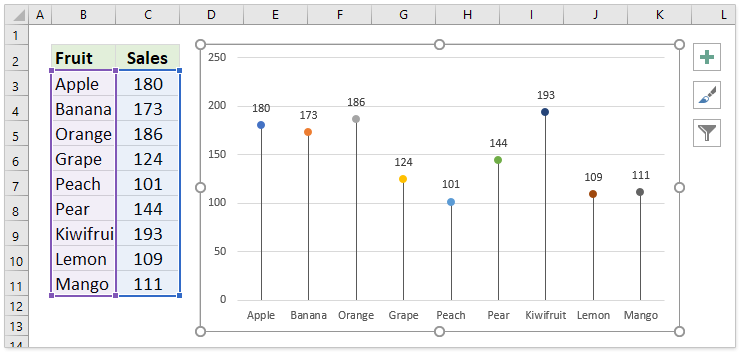
14.Lollipop Chart
The Lollipop Chart slims columns to lines, and adds colorful circles at the end of lines, which makes the point values more attractive visually.
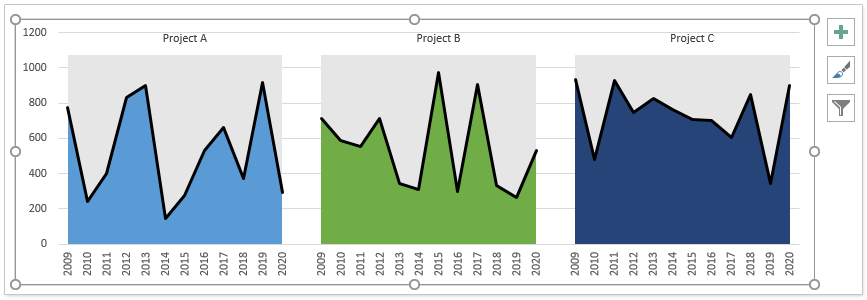
15.Multi Series Area Chart
The Multi Series Area Chart compounds multiple area graphics in one chart, and helps us easily compare multiple sets of values easily in the chart.
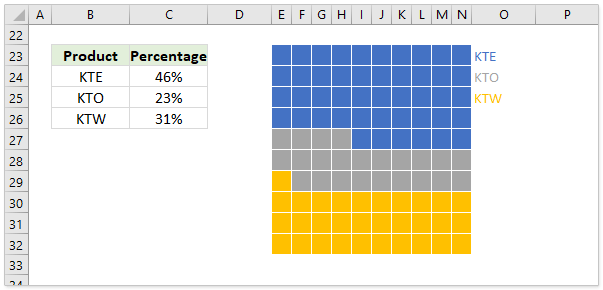
16.Proportion Stacked Chart
The Proportion Stacked Chart can reflect the proportion of each point value in a series with small squares. And It supports two types of graphics:
(1) Show the proportion of each value in a compound stacked chart:
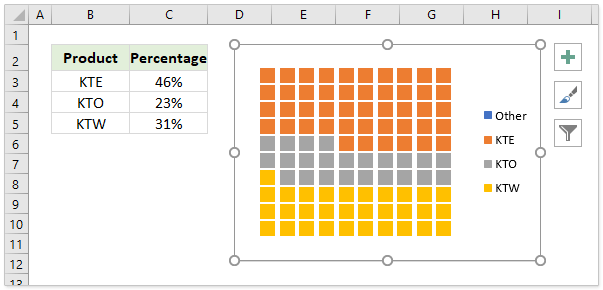
(2) Show the proportion of each value with square filled cells.
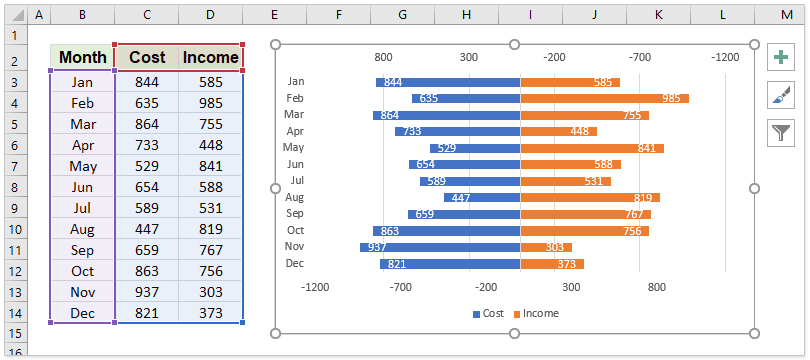
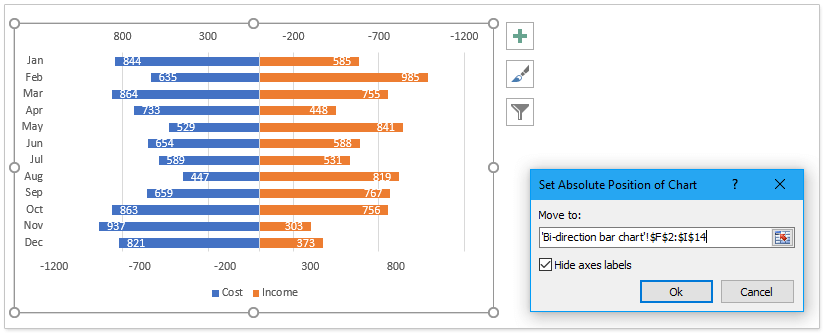
17.BiDirectional Bar Chart
The BiDirectional Bar Chart places two sets of values at two sides of the Y axis, so that we can compare these two sets of values horizontally at ease.
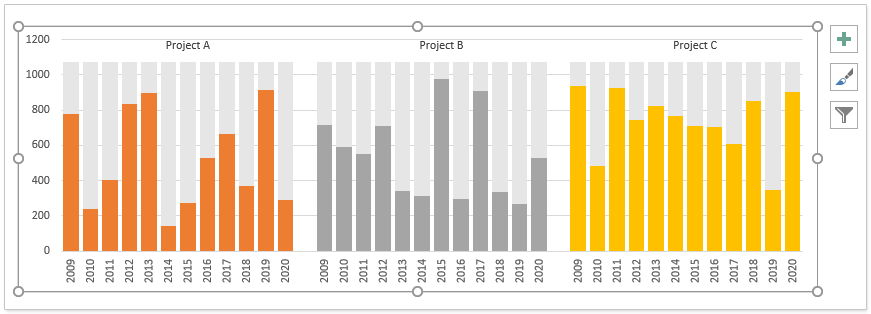
18.Multi Series Histogram Chart
This Multi Series Histogram Chart uses a set of columns to represent a set of data, and combine multiple sets of columns in one chart, so that you can easily distinguish these series.
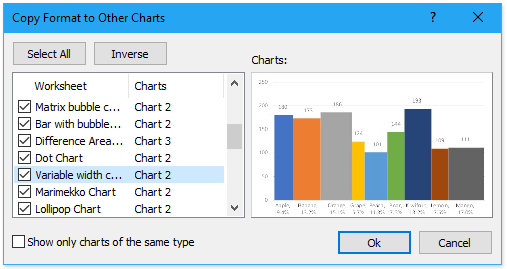
19.Copy Format to Other Charts
This feature will copy the formatting of the currently selected chart to multiple charts of the active workbook in bulk.
20.Set Absolute Position of Chart
This feature will move the currently selected chart to the specified position, and resize the chart to specified range simultaneously.
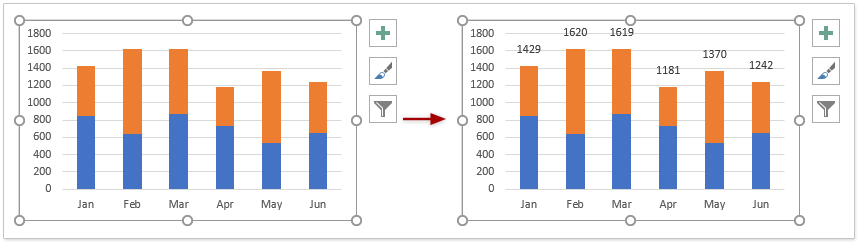
21.Add Sum Labels to Chart
This feature will add the sum labels for the currently selected stacked chart.
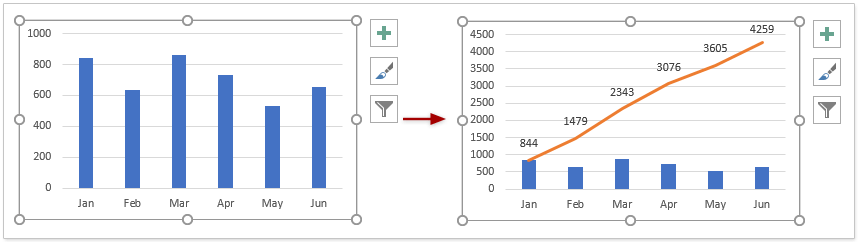
22.Add Cumulative Sum to Chart
This feature will add an accumulated line with accumulated total labels for the currently selected clustered column chart.
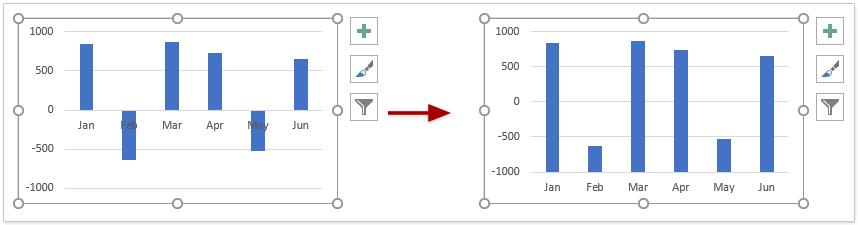
23.Move X-axis to Negative/Zero/Bottom
This feature will move the X axis to the bottom of the currently selected chart.
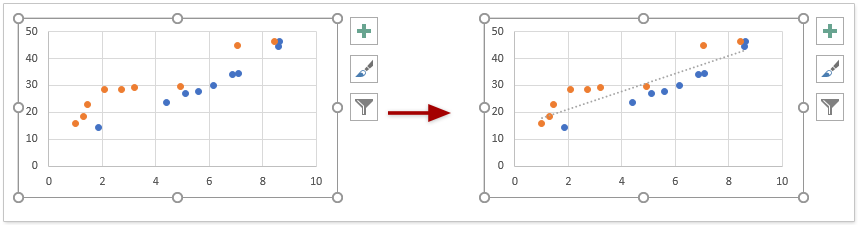
24.Add Trend Lines to Multiple Series
This feature will add a trend line for a scatter chart which contains multiple series of data.
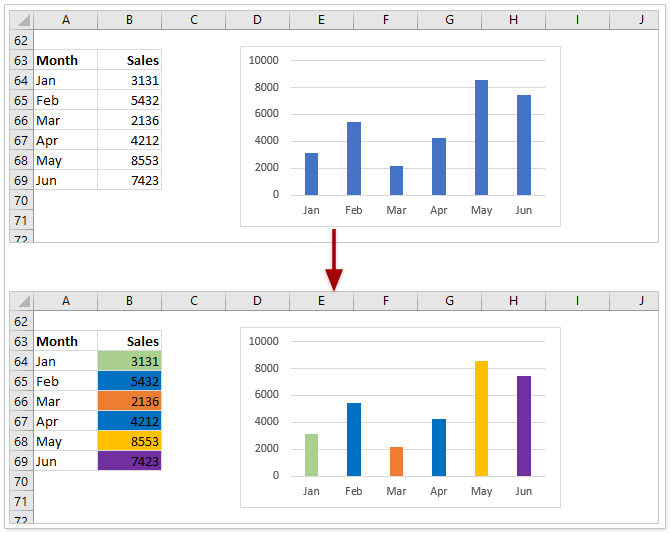
25.Change Chart Color According to Cell Color
This feature will change the fill color of columns, bars, scatters, etc. based on the fill color of corresponding cells in the chart data range.
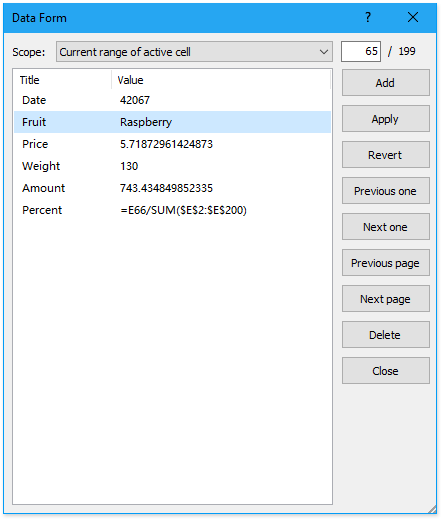
26.Data Form
This feature shows the data in the specified range row by row. In the Data Form dialog, we can read, add, delete, or edit the data in rows.
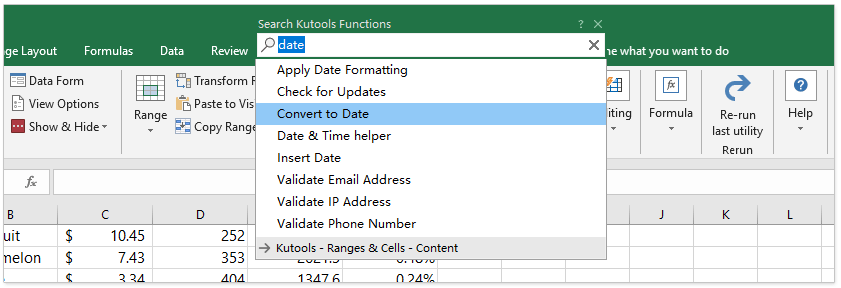
27.Search (Kutools Features)
This feature will help us quick find out and enable the specified Kutools feature by a given keyword.
Improvements
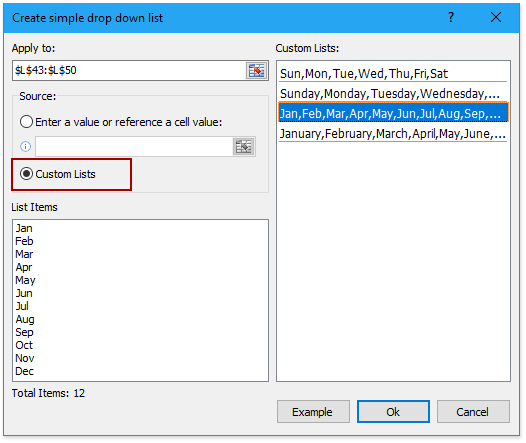
1.Create simple drop-down list
Support to quickly create a drop-down list based on a specified custom list.
2.Make up a number
Support to make up a decimal number or a negative number.
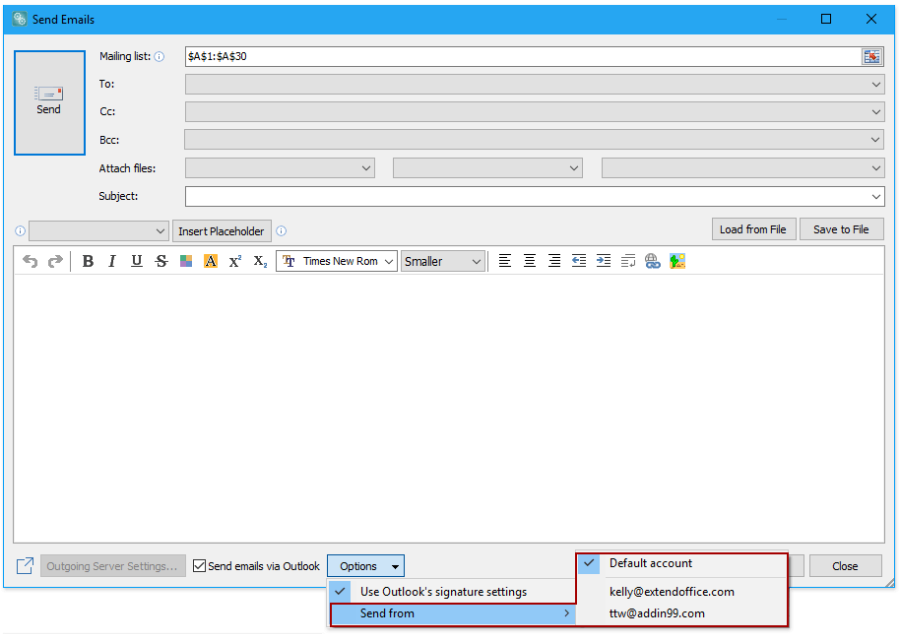
3.Send Emails
1)Add hints to explain some outgoing server settings.
2)When sending emails via Outlook, it supports to specify a sending account.
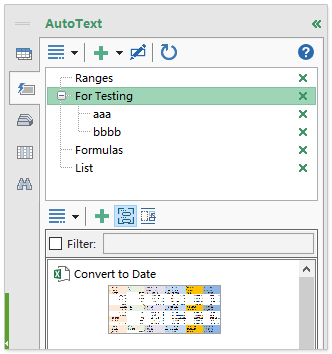
4.Navigation Pane
1) The AutoText pane supports to show the AutoText groups by categories.
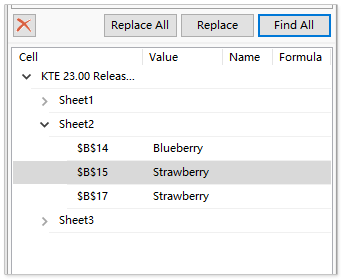
2) The Find and Replace pane supports to find keywords in hyperlinks and chart titles.
3) The Find and Replace pane groups the searching results by sheet.
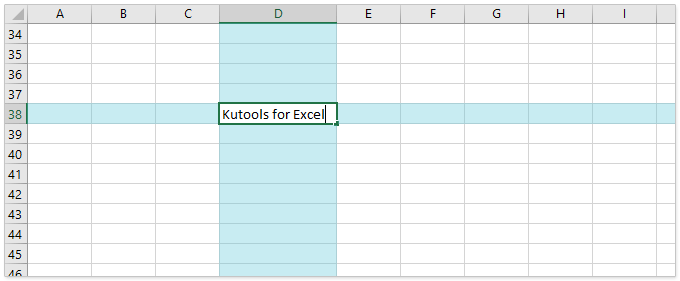
5.Reading Layout
1) Support HDPI;
2) The active cell will not be highlighted when it’s being edited.
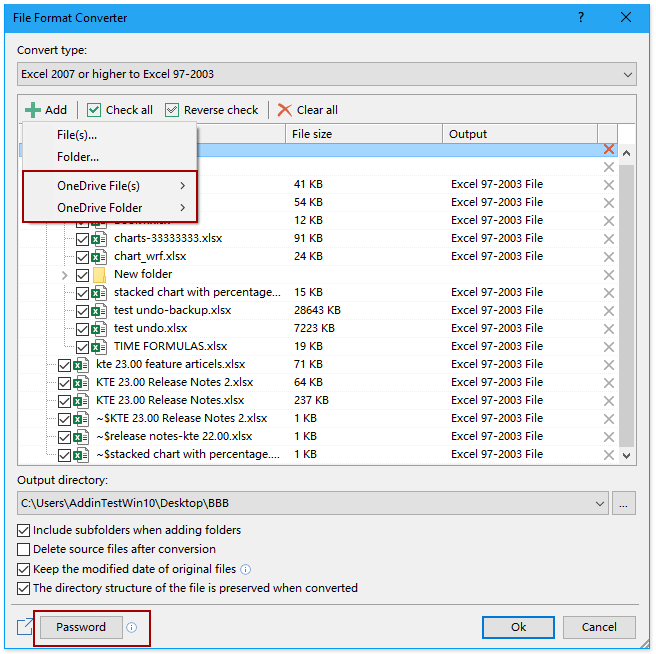
6.File Format Converter
1) Redesign the interface of File Format Converter dialog.
2) Support to add or manage passwords to open protected workbooks.
3) Support OneDrive files and folders.
7.Super Filter
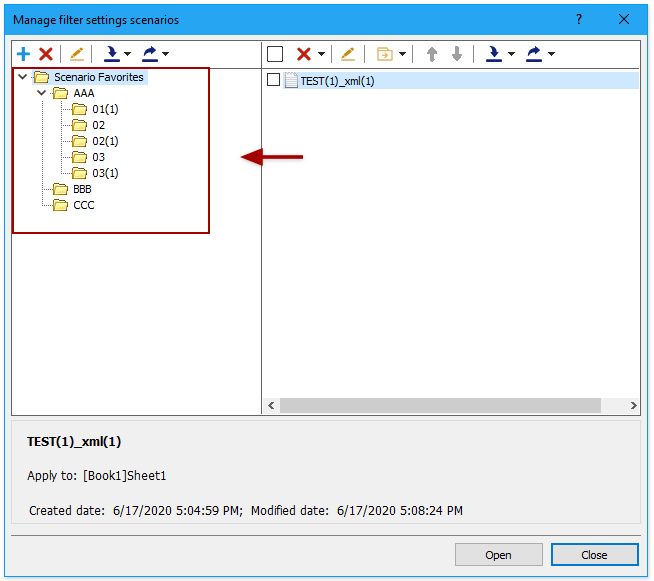
1) Support to add scenarios to favorite folders.
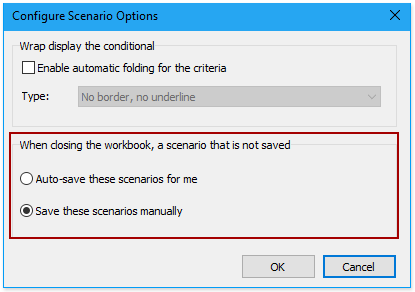
2) Support to automatically save scenarios when closing the workbook.
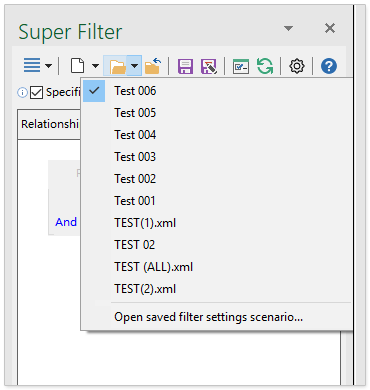
3) The Open saved filter setting scenario drop-down menu lists no more than 10 recently used scenarios.
8.Number to Words
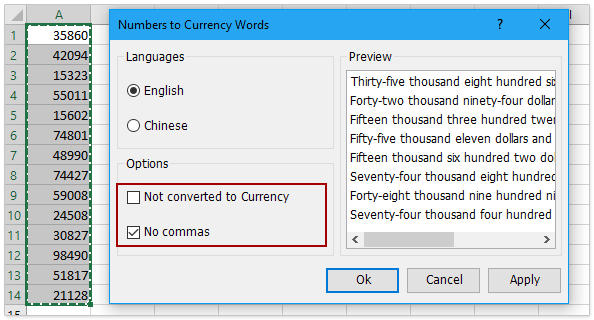
1) Add the Not converted to Currency option. If tick this option, it will not add “dollars” and “cents” for the converted words.
2) Add the No commas option. If tick this option, it will not add commas among the converted words.
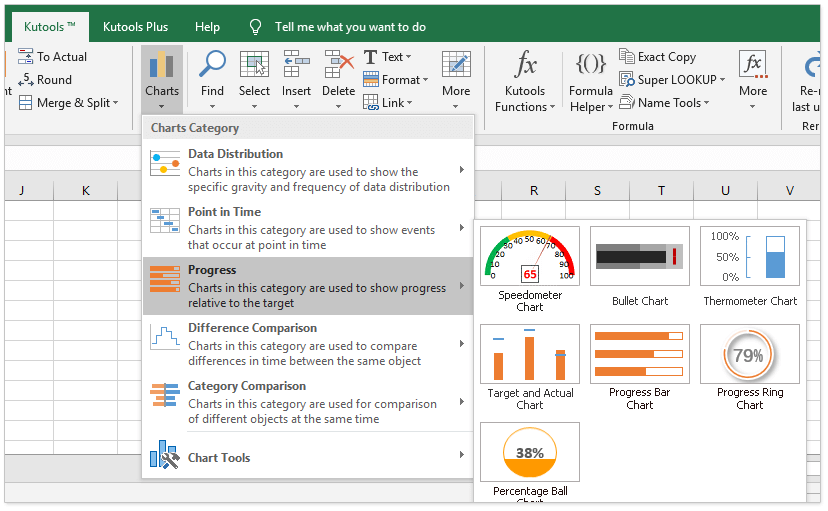
9.Charts
1) Change the layout of the Charts drop-down menu, and show charts by categories.
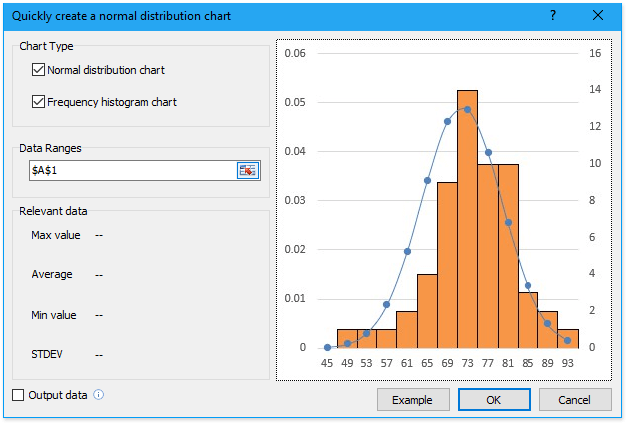
2) Redesign the interface of Quickly create a normal distribution chart dialog.
3) Adjust the running logic of speedometer chart.
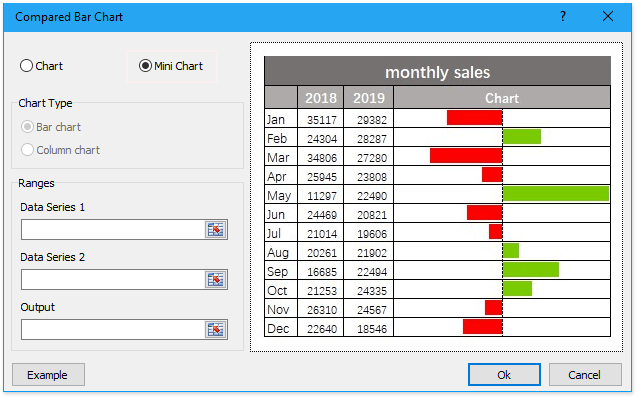
4) Improve the interface of Compared Bar Chart dialog (Difference Comparison Chart), and support to generate mini chart.
10.Installation package
Simplify installation steps, and install the package with administrator rights directly. Non-administrator users can choose to install the package with current rights or with administrator rights if they can obtain.
11.Setting Center
Improve the setting centers, and remains only one setting center. The reserved setting center will be run with the highest authority that the users have.
12.Icon of Kutools for Excel on desktop
Running the icon of Kutools for Excel on desktop will launch Microsoft Excel and enable the Kutools tab, taking place of launching the setting center in earlier versions.
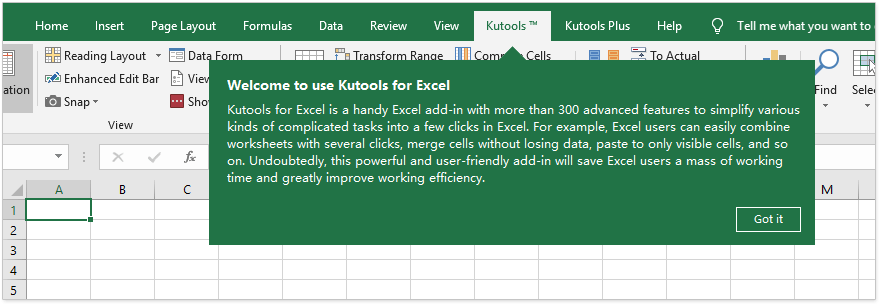
13.Welcome Tips
After installing Kutools for Excel, it will enable the Kutools tab and display the welcome tips automatically when you launch Microsoft Excel for the first time.
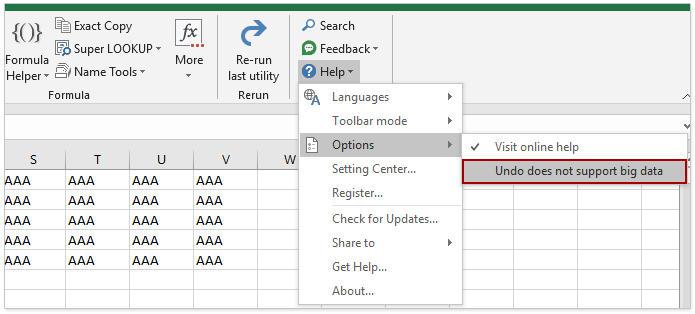
14.Undo
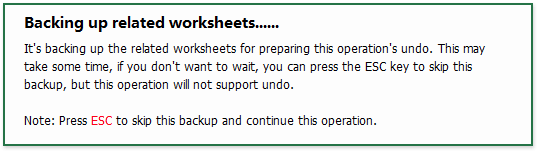
1) Improve undo logic, prompt users it may take a long time to back up data for undo, and support to press ESC key to skip the backup.
2) Add the Undo does not support big data option.
15.Improve and speed up some features.
Fixed
1. Navigation Pane
1)The Navigation Pane can be resized to unlimited big or small size when it’s floating.
2)The Column List pane reports errors in some cases.
3)The Workbook & Sheet pane cannot display the created macro sheets (MS Excel 4.0 Macro), and cannot switch between these macro sheets in the pane.
4)When there are no active workbooks, the Navigation Pane reports errors if clicking the Toggle to hide / unhide all hidden worksheet(s) button.
2. Errors occur when enabling the drop-down List with check boxes feature in merged cells.
3. Super Filter
1)The newly added sub-criteria groups cannot display.
2)After recovering the saved scenarios, they are lost again when switching worksheets.
4. The Transform Range feature may lead to hyperlinks lost.
5. Send Emails
1)When sending emails by SMTP, emails are failed to send via Office 365 email account (caused by the message body ends with line breaks).
2)When sending emails by Outlook, the default signature of the sending email account cannot be obtained in some cases.
3)When sending emails by SMTP, the message body cannot correctly display the special characters in the placeholders, such as line breaks, >, etc.
4)In some cases, if both the Send emails via Outlook option and the Outgoing Server Settings did not specify, the SMTP Setting dialog will pop out when clicking at the toolbar area.
6. Other minor bugs.
Tip: full function & feature, free trial in 30 days! If the 2-year free upgrade support period is not expired, you are entitled to free upgrade this version.
New Features
1.Dumbbell Plot Chart
The Dumbbell Plot chart can be used to compare two sets of data, and show the differences between them with lines in a chart.
2.Progress Ring Chart
This Progress Ring Chart is commonly used to show the completion percentage of a project, with showing the completion percentage in the middle of doughnut.
3.Percentage Ball Chart
The Percentage Ball Chart is commonly used to show the percentage of something occupied or remaining, or the completion percentage of a project. This chart supports to change border color, background color, and foreground color of the ball.
4.Progress Bar Chart
Comparing with above Progress Ring Chart or Percentage Ball Chart can only show the completion percentage of one project, the Progress Bar Chart can show the completion percentages of multiple projects in one chart.
The Progress Bar Chart can create a chart based on the given completion percentage.
It also supports to create a chart based on the given actual and target values without figuring out the completion percentages in advance.
5.Slope Chart
You can easily create a Slope Chart in Excel to visually show the difference between two categories at two times.
6.Threshold Value Chart
The Threshold Value Chart compares the data points with a given threshold value, and show the differences between data points and the threshold value by column direction, column height, and color.
7.Difference Arrow Chart
This Different Arrow Chart is similar as a clustered column or bar charts, but add arrows and percentages to show the differences between two sets of data.
8.Matrix Bubble Chart
This feature helps to create a Matrix Bubble Chart with only several clicks in Excel. The matrix bubble chart represents data points by bubbles in a matrix, which is fit to compare multiple sets of data horizontally and vertically.
9.Bar with Bubbles Chart
A general clustered bar chart can only show a set of data. The Bar with Bubbles Chart enhances the bar chart, and helps us show two sets of data horizontally: use bars to show one set of data in left side, and use bubbles to show the other set of data in right side.
10.Difference Area Chart
The Difference Area Chart draws two lines for two sets of data, and use the filled room between the two lines to show the differences between two sets of data.
11.Dot Chart
The Dot Chart uses markers to show data, which looks like the scatter chart. But this chart assigns both X and Y axes with two sets of data.
12.Variable Width Column Chart
Different from normal column showing one-dimension data by column heights, the Variable Width Column Chart can show two sets of values across two dimensions by both column widths and column heights.
13.Marimekko Chart
The Marimekko Chart compounds multiple stacked columns in a chart, and shows all sets of values across three dimensions.
14.Lollipop Chart
The Lollipop Chart slims columns to lines, and adds colorful circles at the end of lines, which makes the point values more attractive visually.
15.Multi Series Area Chart
The Multi Series Area Chart compounds multiple area graphics in one chart, and helps us easily compare multiple sets of values easily in the chart.
16.Proportion Stacked Chart
The Proportion Stacked Chart can reflect the proportion of each point value in a series with small squares. And It supports two types of graphics:
(1) Show the proportion of each value in a compound stacked chart:
(2) Show the proportion of each value with square filled cells.
17.BiDirectional Bar Chart
The BiDirectional Bar Chart places two sets of values at two sides of the Y axis, so that we can compare these two sets of values horizontally at ease.
18.Multi Series Histogram Chart
This Multi Series Histogram Chart uses a set of columns to represent a set of data, and combine multiple sets of columns in one chart, so that you can easily distinguish these series.
19.Copy Format to Other Charts
This feature will copy the formatting of the currently selected chart to multiple charts of the active workbook in bulk.
20.Set Absolute Position of Chart
This feature will move the currently selected chart to the specified position, and resize the chart to specified range simultaneously.
21.Add Sum Labels to Chart
This feature will add the sum labels for the currently selected stacked chart.
22.Add Cumulative Sum to Chart
This feature will add an accumulated line with accumulated total labels for the currently selected clustered column chart.
23.Move X-axis to Negative/Zero/Bottom
This feature will move the X axis to the bottom of the currently selected chart.
24.Add Trend Lines to Multiple Series
This feature will add a trend line for a scatter chart which contains multiple series of data.
25.Change Chart Color According to Cell Color
This feature will change the fill color of columns, bars, scatters, etc. based on the fill color of corresponding cells in the chart data range.
26.Data Form
This feature shows the data in the specified range row by row. In the Data Form dialog, we can read, add, delete, or edit the data in rows.
27.Search (Kutools Features)
This feature will help us quick find out and enable the specified Kutools feature by a given keyword.
Improvements
1.Create simple drop-down list
Support to quickly create a drop-down list based on a specified custom list.
2.Make up a number
Support to make up a decimal number or a negative number.
3.Send Emails
1)Add hints to explain some outgoing server settings.
2)When sending emails via Outlook, it supports to specify a sending account.
4.Navigation Pane
1) The AutoText pane supports to show the AutoText groups by categories.
2) The Find and Replace pane supports to find keywords in hyperlinks and chart titles.
3) The Find and Replace pane groups the searching results by sheet.
5.Reading Layout
1) Support HDPI;
2) The active cell will not be highlighted when it’s being edited.
6.File Format Converter
1) Redesign the interface of File Format Converter dialog.
2) Support to add or manage passwords to open protected workbooks.
3) Support OneDrive files and folders.
7.Super Filter
1) Support to add scenarios to favorite folders.
2) Support to automatically save scenarios when closing the workbook.
3) The Open saved filter setting scenario drop-down menu lists no more than 10 recently used scenarios.
8.Number to Words
1) Add the Not converted to Currency option. If tick this option, it will not add “dollars” and “cents” for the converted words.
2) Add the No commas option. If tick this option, it will not add commas among the converted words.
9.Charts
1) Change the layout of the Charts drop-down menu, and show charts by categories.
2) Redesign the interface of Quickly create a normal distribution chart dialog.
3) Adjust the running logic of speedometer chart.
4) Improve the interface of Compared Bar Chart dialog (Difference Comparison Chart), and support to generate mini chart.
10.Installation package
Simplify installation steps, and install the package with administrator rights directly. Non-administrator users can choose to install the package with current rights or with administrator rights if they can obtain.
11.Setting Center
Improve the setting centers, and remains only one setting center. The reserved setting center will be run with the highest authority that the users have.
12.Icon of Kutools for Excel on desktop
Running the icon of Kutools for Excel on desktop will launch Microsoft Excel and enable the Kutools tab, taking place of launching the setting center in earlier versions.
13.Welcome Tips
After installing Kutools for Excel, it will enable the Kutools tab and display the welcome tips automatically when you launch Microsoft Excel for the first time.
14.Undo
1) Improve undo logic, prompt users it may take a long time to back up data for undo, and support to press ESC key to skip the backup.
2) Add the Undo does not support big data option.
15.Improve and speed up some features.
Fixed
1. Navigation Pane
1)The Navigation Pane can be resized to unlimited big or small size when it’s floating.
2)The Column List pane reports errors in some cases.
3)The Workbook & Sheet pane cannot display the created macro sheets (MS Excel 4.0 Macro), and cannot switch between these macro sheets in the pane.
4)When there are no active workbooks, the Navigation Pane reports errors if clicking the Toggle to hide / unhide all hidden worksheet(s) button.
2. Errors occur when enabling the drop-down List with check boxes feature in merged cells.
3. Super Filter
1)The newly added sub-criteria groups cannot display.
2)After recovering the saved scenarios, they are lost again when switching worksheets.
4. The Transform Range feature may lead to hyperlinks lost.
5. Send Emails
1)When sending emails by SMTP, emails are failed to send via Office 365 email account (caused by the message body ends with line breaks).
2)When sending emails by Outlook, the default signature of the sending email account cannot be obtained in some cases.
3)When sending emails by SMTP, the message body cannot correctly display the special characters in the placeholders, such as line breaks, >, etc.
4)In some cases, if both the Send emails via Outlook option and the Outgoing Server Settings did not specify, the SMTP Setting dialog will pop out when clicking at the toolbar area.
6. Other minor bugs.


There are no replies made for this post yet.