Quickly create a Variable Width Column Chart in Excel
Kutools for Excel
Boosts Excel With 300+
Powerful Features
In a normal clustered column chart, the column widths are same, and values are compared by column heights. This is fit for comparing one-dimensional data, says comparing sales amount of fruits. However, how could we compare two dimensions of data in a clustered column chart, says show both prices and sales amount of fruits? In this case, we can create a variable width column chart to solve the problem: use column widths to compare one dimensional data, and use column heights to compare the other dimensional data.
Create a Variable Width Column Chart in Excel
Click Kutools > Charts > Category Comparison > Variable Width Column Chart to enable this feature:

Create a Variable Width Column Chart in Excel
You can apply the Variable Width Column Chart, provided by Kutools for Excel, to quickly create a variable width column chart in Excel.
1. In Excel, prepare the source data as below screenshot shown.
2. Click Kutools > Charts > Category Comparison > Variable Width Column Chart to enable this feature.
3. In the Variable Width Column Chart dialog, please do as follows:
(1) In the Axis Labels box, specify the range of axis labels;
(2) In the Series width box, specify the range of data (the first dimension data) that controls the column widths;
(3) In the Series height box, specify the range of data (the other dimension data) that controls the column heights;
(4) If necessary, tick the Show series percentage option and specify the decimal places as you need;
(5) Click the Ok button.
4. A dialog comes out and tells you it will create a hidden sheet to store some intermediate data for the variable width column chart. Please click the Yes button to go ahead.
Now the variable width column chart is created.
If you have ticked the Show series percentage option in above Variable Width Column Chart dialog, the chart will look like following screenshot:
If you have not ticked the Show series percentage option in above Variable Width Column Chart dialog:
Notes
1. Labels in the chart (take the third column for example):
(1) Orange, 15.1%: Orange means this column represents the orange data; 15.1% indicates the orange price is 15.1% of total prices of all fruits, and it’s the orange column width.
(2) 186: 186 is the sale amount of orange.
2. When creating the variable width column chart, it generates intermediate data. We can read the data as follows:
(1) Right click any sheet tab in the Sheet tab bar, and select Unhide from the context menu;
(2) In the Unhide window, click to select Kutools_Chart sheet, and click the OK button.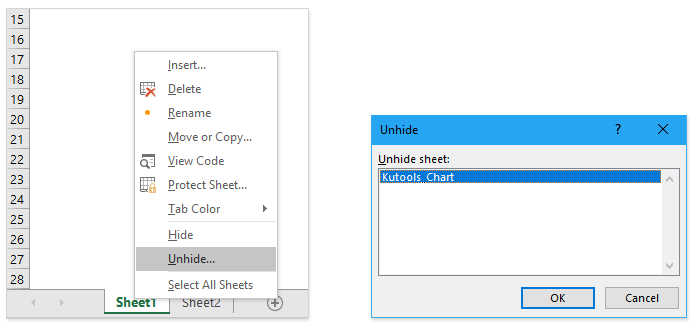
(3) Then we can read the intermediate data in the Kutools_Chart sheet as following screenshot shown:
3. In the Variable Width Column Chart dialog, you can click the Example button to close the current dialog and open the example sheet.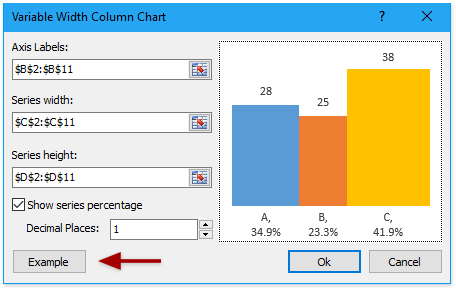
4. This Variable Width Column Chart feature cannot be applied in Excel 2007 and earlier versions; In Excel 2010, this feature does not support the Show Series Percentage option; and this feature works well in Excel 2013 and later versions.
5. This Variable Width Column Chart feature supports undo.
Productivity Tools Recommended
Office Tab: Use handy tabs in Microsoft Office, just like Chrome, Firefox, and the new Edge browser. Easily switch between documents with tabs — no more cluttered windows. Know more...
Kutools for Outlook: Kutools for Outlook offers 100+ powerful features for Microsoft Outlook 2010–2024 (and later versions), as well as Microsoft 365, helping you simplify email management and boost productivity. Know more...
Kutools for Excel
Kutools for Excel offers 300+ advanced features to streamline your work in Excel 2010 – 2024 and Microsoft 365. The feature above is just one of many time-saving tools included.
