How to Count Unique Rows Based on Two Columns in Excel
Sometimes a row is considered unique only when values from two columns are evaluated together. For example, in a customer purchase list, the same customer may appear several times and the same product may also appear several times, but what you really need to know is how many Customer ID + Product combinations occur only once.
Count unique rows based on two ranges in Kutools for Excel's Formula Helper Plus helps you calculate this without manually building a complex COUNTIFS formula. Available in the Local library under the Count category, it pairs values from two ranges row by row and counts the combinations that appear exactly once.
Advantages of the Count unique rows based on two ranges formula
How to count unique rows based on two ranges
- Count rows with unique combinations in two columns
- Understand Range1 and Range2
- How the generated formula works
Advantages of the Count unique rows based on two ranges formula
Count unique rows based on two ranges provides a convenient way to count records whose uniqueness depends on two values together. Instead of building and troubleshooting a multi-condition formula manually, you can select the two corresponding ranges and let Formula Helper Plus create the formula for you.
Evaluate two fields together
Treat values from two corresponding columns, such as Customer ID + Product, as one row combination instead of checking each column separately.
Count only combinations that occur once
Repeated combinations are automatically excluded, so the result represents only rows whose two-value combination appears exactly once.
No need to build a complex formula manually
Specify Range1 and Range2 in clearly labeled boxes, and Formula Helper Plus creates the required COUNTIFS-based formula automatically.
Useful for many paired-record scenarios
Apply the same approach to customer and product, employee and date, product and region, order and item, or other pairs of related fields.
How to count unique rows based on two ranges
Count unique rows based on two ranges lets you determine how many row combinations occur only once by comparing two corresponding ranges. This section shows how to use the formula, explains the two required arguments, and describes how the generated formula identifies unique rows.
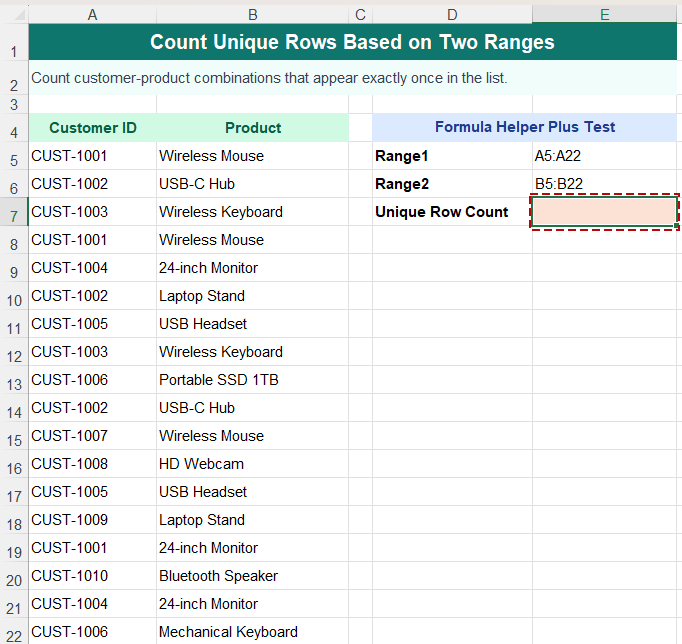
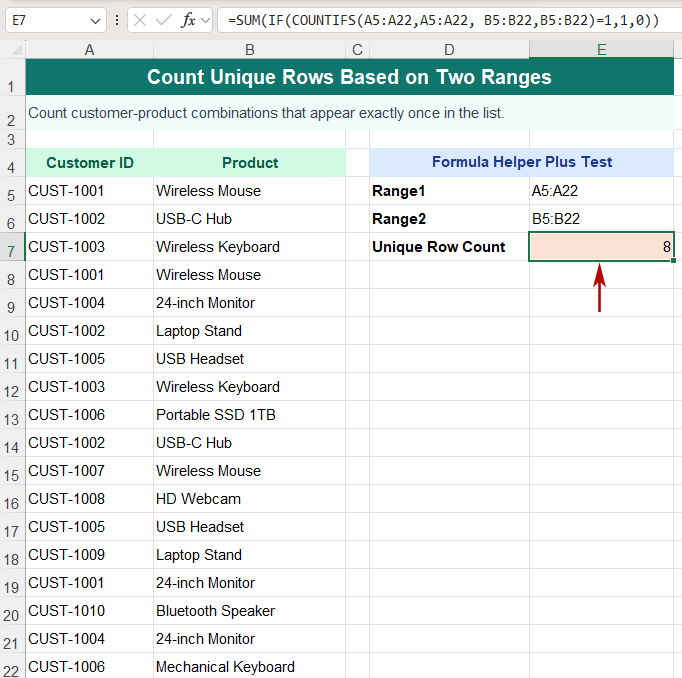
In the example below, Customer ID and Product are evaluated together. Some customer-product combinations appear more than once, while others occur only once.
Count rows with unique combinations in two columns
Use this method when the uniqueness of a record depends on the combination of values in two columns. In this example, each Customer ID + Product pair is treated as one record.
1. Select the cell where you want the unique row count to appear.
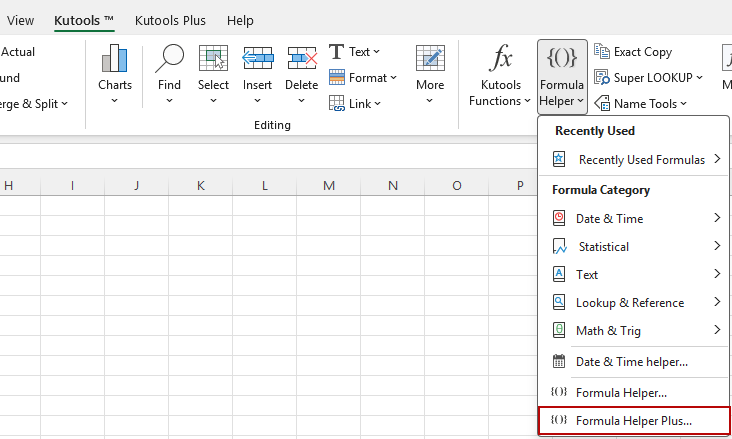
2. Click Kutools > Formula Helper > Formula Helper Plus.
3. In Formula Helper Plus, make sure the Local tab is selected. Under Category, click Count, then select Count unique rows based on two ranges.
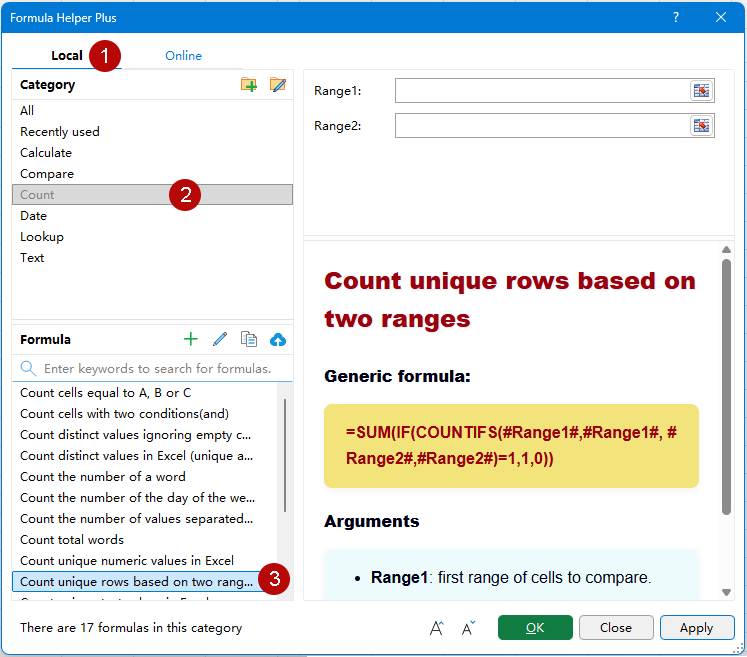
Tip: You can also enter keywords such as unique rows in the search box to quickly find the formula.
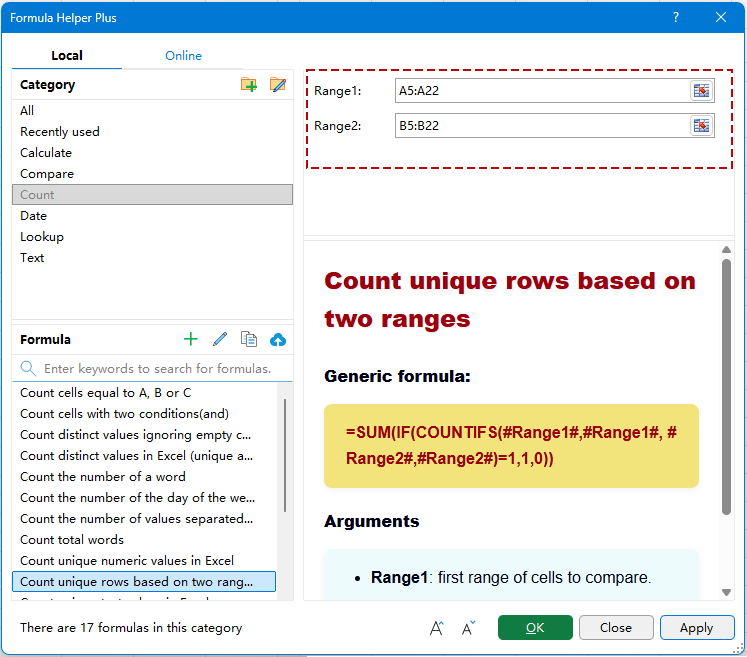
4. Specify the two ranges. In this example, select the Customer ID range as Range1 and the corresponding Product range as Range2.
5. Click OK or Apply to insert the formula and calculate the number of unique row combinations.
Result: The formula returns 8, meaning eight Customer ID + Product combinations in the sample data occur exactly once. Combinations that appear more than once are not included in the count.
Understand Range1 and Range2
The two ranges are evaluated together row by row. Each pair of cells forms one combination that is checked against all other combinations in the selected data.
| Argument | What to specify | Example |
| Range1 | The first range used to form each row combination. | Customer ID range |
| Range2 | The second range paired with Range1. | Product range |
For example, if Range1 contains Customer IDs and Range2 contains Products, the values are paired like this:
Customer ID 1 + Product 1
Customer ID 2 + Product 2
Customer ID 3 + Product 3
...
Tip: Range1 and Range2 should cover the same number of rows and represent corresponding records. For example, use A5:A22 together with B5:B22.
How the generated formula works
Formula Helper Plus generates a formula that uses COUNTIFS to check how many times each two-value combination occurs. Its generic structure is:
=SUM(IF(COUNTIFS(Range1,Range1,Range2,Range2)=1,1,0))In the sample data, Customer IDs are stored in A5:A22 and Products are stored in B5:B22. The formula checks each Customer ID together with the Product on the same row.
The formula works in three parts:
- COUNTIFS counts how many times each Customer ID + Product combination appears in the two ranges.
- IF returns 1 when a combination appears exactly once and 0 when it appears more than once.
- SUM adds the 1s together to return the total number of unique rows.
For example, CUST-1001 + Wireless Mouse appears twice, so neither occurrence contributes to the unique row count. In contrast, CUST-1001 + 24-inch Monitor appears only once, so it contributes 1 to the result.
Unique rows vs. distinct row combinations
Unique and distinct do not mean the same thing when counting combinations. Understanding the difference helps you determine whether this formula produces the result you need.
| Customer | Product |
| Ava | Laptop |
| Ava | Laptop |
| Ethan | Mouse |
Unique rows: Only Ethan + Mouse appears exactly once, so the unique row count is 1.
Distinct combinations: There are two different combinations—Ava + Laptop and Ethan + Mouse—so the distinct combination count is 2.
Key point: Count unique rows based on two ranges counts combinations that occur exactly once. It does not count every different combination after duplicates are removed.
Tips for accurate results
For reliable results, make sure the two ranges represent the same set of records and that the values are stored consistently.
- Use ranges of the same size: Range1 and Range2 should contain the same number of rows, such as A5:A22 and B5:B22.
- Keep corresponding records on the same row: Each value in Range1 is paired with the value from Range2 on the same row.
- Exclude header cells: Select only the data ranges unless the headers are intentionally part of the values you want to evaluate.
- Check for extra spaces: Values such as Wireless Mouse and Wireless Mouse may look identical but contain different text and may therefore be treated as different combinations.
- Keep data types consistent: A numeric value and a similar-looking number stored as text may not always be treated identically.
- Review blank cells: Blank values can become part of a row combination, so check whether empty cells in either range are intentional before calculating the result.
Practical use cases
Counting unique combinations across two fields is useful when a single column is not enough to determine whether a record should be considered unique.
Count unique customer-product combinations
Combine a Customer ID with a Product to identify purchase combinations that appear only once in sales or transaction records.
Count unique employee-date records
Pair Employee IDs with dates to count attendance, submission, scheduling, or activity records that occur only once.
Count unique product-region combinations
Combine Products with Regions to identify product-region records that appear only once in sales, inventory, or distribution data.
Count unique order-item combinations
Pair Order IDs with Item IDs to count combinations that occur only once in an order or transaction dataset.
About Formula Helper Plus
Formula Helper Plus in Kutools for Excel provides a collection of practical formulas through a guided interface, helping you find, understand, and insert formulas without having to remember their complete syntax.
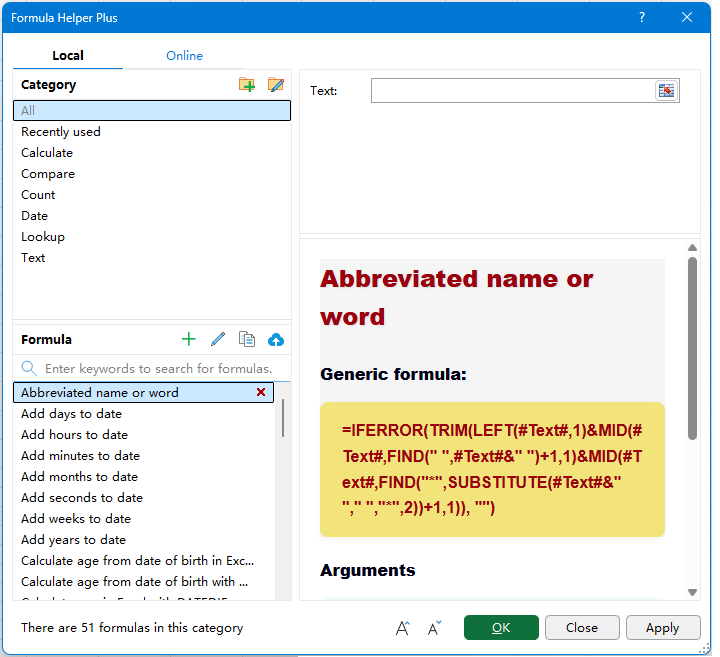
The interface includes Local and Online formula libraries. The Local library contains formulas organized into categories such as Calculate, Compare, Count, Date, Lookup, and Text. You can browse formulas by category or use the search box to find one by name or purpose. The Online library provides additional formulas that you can browse separately.
After selecting a formula, the right-hand pane displays its description, generic formula, arguments, and other helpful information, while separate input boxes let you specify the required ranges or values before inserting the formula into the worksheet. For example, Count unique rows based on two ranges is available in the Local library under the Count category.
🗂️ Category tools in Local
Use the category tools in the Local library to browse built-in formula groups and organize categories for formulas you create yourself.
- Category list: Browse formulas by task, including Calculate, Compare, Count, Date, Lookup, and Text.
 Add category: Create a custom category for organizing formulas you add to the Local library.
  Rename category: Rename a custom category to better reflect the formulas it contains.
 Add category: Create a custom category for organizing formulas you add to the Local library.
  Rename category: Rename a custom category to better reflect the formulas it contains.
 🧮 Formula tools in Local
Use the formula tools in the Local library to search for formulas or create and manage your own reusable formulas.
- Search: Enter keywords in the search box to quickly find formulas by name or purpose.
 Add formula: Create a custom formula and assign it to a category. When defining the formula, enclose each variable argument in # signs, such as #Range#.
  Edit formula: Modify a custom formula's expression, category, or description.
  Copy formula: Create an editable copy of the selected formula, which is useful when you want to build a new formula based on an existing one.
  Upload formula: Upload and share a formula from the Local library to contribute it to the Online formula library.
 Add formula: Create a custom formula and assign it to a category. When defining the formula, enclose each variable argument in # signs, such as #Range#.
  Edit formula: Modify a custom formula's expression, category, or description.
  Copy formula: Create an editable copy of the selected formula, which is useful when you want to build a new formula based on an existing one.
  Upload formula: Upload and share a formula from the Local library to contribute it to the Online formula library.
 🔤 Display controls
The display controls are available in both the Local and Online libraries. Use them to adjust the text size in the right-hand information pane for easier reading.
 Increase font size: Enlarge the formula description, generic formula, arguments, and other information displayed in the right-hand pane.
  Decrease font size: Reduce the text size in the right-hand pane when you want to view more information at once.
 Increase font size: Enlarge the formula description, generic formula, arguments, and other information displayed in the right-hand pane.
  Decrease font size: Reduce the text size in the right-hand pane when you want to view more information at once.
 FAQ
What does Count unique rows based on two ranges count?
It counts rows where the combination of the value in Range1 and the corresponding value in Range2 appears exactly once in the selected data.
Is counting unique rows the same as counting distinct combinations?
No. A unique row combination must occur only once. A distinct count includes each different combination once, even when some combinations appear multiple times in the source data.
Are Range1 and Range2 compared row by row?
Yes. The first value in Range1 is paired with the first value in Range2, the second value is paired with the second value, and so on. Each pair is treated as one row combination.
Do Range1 and Range2 need to contain the same number of rows?
Yes. The two ranges should cover corresponding records and contain the same number of rows so that each value in Range1 has a corresponding value in Range2.
What happens if the same combination appears twice?
That combination is not counted as unique. Because it appears more than once, all occurrences of that combination are excluded from the unique row count.
Can I use text and numbers in the two ranges?
Yes. The ranges can contain text, numbers, dates, and other Excel values. For accurate results, make sure values that are intended to match use consistent data types.
Will the unique row count update when the source data changes?
Yes. Because the result is inserted as an Excel formula, changes within the referenced ranges can be reflected when Excel recalculates the worksheet.
Where can I find Count unique rows based on two ranges?
Open Formula Helper Plus, select the Local tab, and choose the Count category. Then select Count unique rows based on two ranges. You can also use the search box to find it by keyword.
Productivity Tools Recommended
Office Tab: Use handy tabs in Microsoft Office, just like Chrome, Firefox, and the new Edge browser. Easily switch between documents with tabs — no more cluttered windows. Know more...
Kutools for Outlook: Kutools for Outlook offers 100+ powerful features for Microsoft Outlook 2010–2024 (and later versions), as well as Microsoft 365, helping you simplify email management and boost productivity. Know more...
Kutools for Excel
Kutools for Excel offers 300+ advanced features to streamline your work in Excel 2010 – 2024 and Microsoft 365. The feature above is just one of many time-saving tools included.

Table of Contents
- Advantages of the Count unique rows based on two ranges formula
- How to count unique rows based on two ranges
- Count rows with unique combinations in two columns
- Understand Range1 and Range2
- How the generated formula works
- Unique rows vs. distinct row combinations
- Tips for accurate results
- Practical use cases
- About Formula Helper Plus
- FAQ
- The Best Office Productivity Tools
Kutools for Excel
Brings 300+ advanced features to Excel
- 🧩 Overview
- 📥 Free Download
- 🎁 30-Day Free Trial available