Create a multi-layer column chart in Excel
Kutools for Excel
Boosts Excel With 300+
Powerful Features
In Excel, the built-in column chart is used to compare the values across a few categories. However, in some cases, there are multiple values in one category, how to display and compare all values of each category in a column chart? With Kutools for Excel, the Multi Layer Column Chart in the Charts tool can create a column chart with multi layers for you in Excel.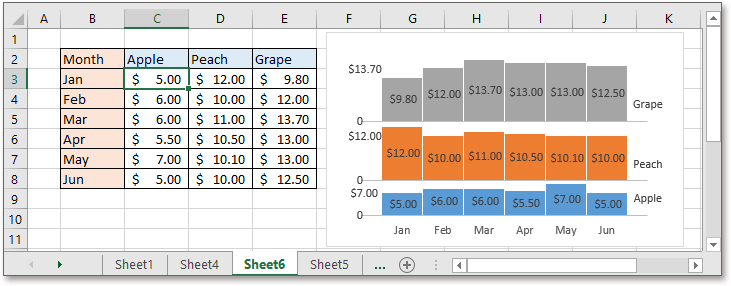
Create a multi-layer column chart
Click Kutools > Charts > Category Comparison > Multi Layer Column Chart. See screenshot: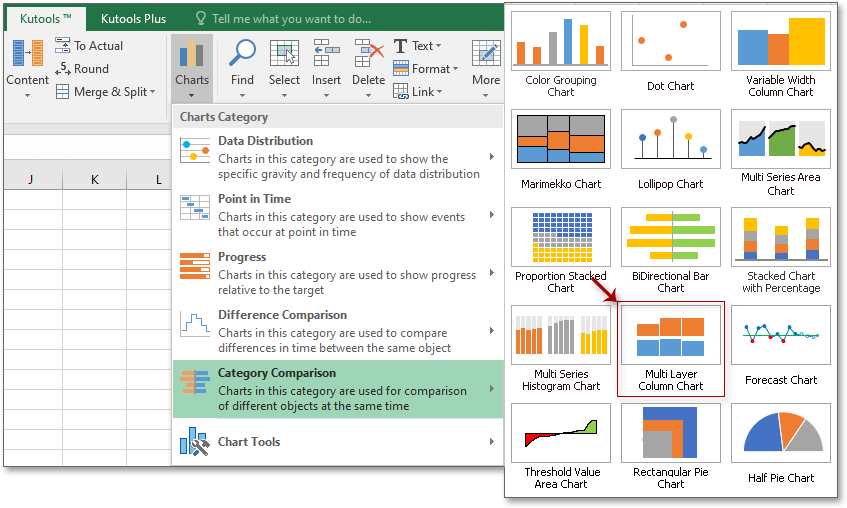
In the Multi Layer Column Chart dialog, click the browse button ![]() to select the data range including headers to the Data range section, then specify one style of chart and decide to show or hide data labels as you need in the Chart Type section.
to select the data range including headers to the Data range section, then specify one style of chart and decide to show or hide data labels as you need in the Chart Type section.
Show data labels: tick this checkbox, the values of every data will be displayed in the related column, otherwise, nothing will be shown in the columns.
Example: if you use this utility for the first time, you can click the Example button to open a new workbook which contains example data and the created multi-layer column chart for you to study.
Click Ok, the multi-layer column chart has been created.
Style 1: show X and Y axis labels.
Style 2: show X and Y axis labels, and the top values of each category.
Style 3: show x axis labels only.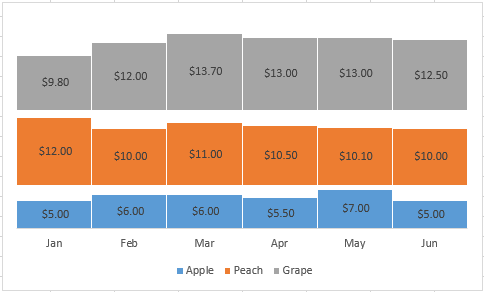
Note:
1. If the data is changed greatly, the chart may be changed incorrectly. In this case, please recreate the chart based on the new data.
2. In Excel 2007 and 2010, the chart may be shown incorrectly while changing original data.
3. A hidden sheet named Kutools_Chart will be created to store data, do not change the data in this sheet, otherwise, some error may occur.
Productivity Tools Recommended
Office Tab: Use handy tabs in Microsoft Office, just like Chrome, Firefox, and the new Edge browser. Easily switch between documents with tabs — no more cluttered windows. Know more...
Kutools for Outlook: Kutools for Outlook offers 100+ powerful features for Microsoft Outlook 2010–2024 (and later versions), as well as Microsoft 365, helping you simplify email management and boost productivity. Know more...
Kutools for Excel
Kutools for Excel offers 300+ advanced features to streamline your work in Excel 2010 – 2024 and Microsoft 365. The feature above is just one of many time-saving tools included.
