Analyze Excel Data with AI Using Smart Pivot
Looking at a large Excel table, sometimes the hardest part is not creating a PivotTable — it is deciding what to analyze first. Should you compare sales by region, summarize orders by product, check category performance, or look for patterns across multiple fields?
Smart Pivot in ZKutools Anywhere for Excel helps you move from raw data to useful analysis ideas faster. It uses AI to review your selected data source, understand the fields in your table, and recommend practical PivotTable-style analysis schemes you can apply directly in Excel.
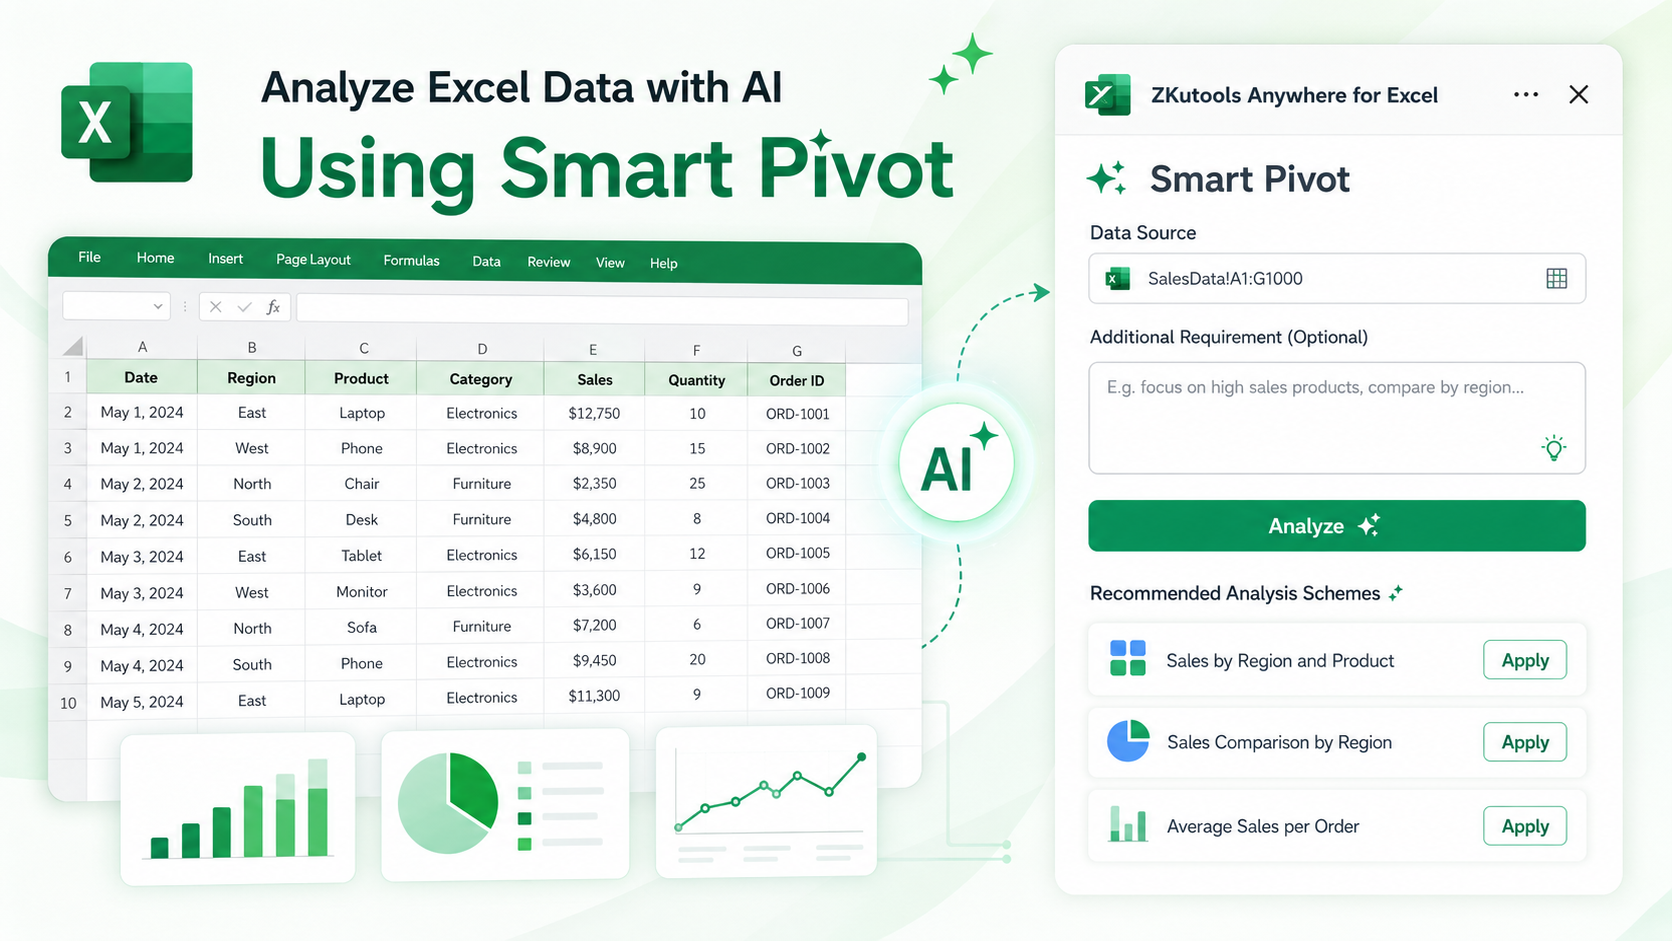
Advantages of Smart Pivot
Find Useful Analysis Ideas Faster
When a table contains many columns, it is easy to overlook useful report angles. Smart Pivot scans your selected data and suggests analysis schemes based on the fields available in your worksheet.
Turn Raw Data into PivotTable-Style Reports
Instead of manually testing different PivotTable layouts, you can start with AI-recommended schemes such as sales comparisons, cross analysis by multiple fields, or summary statistics.
Focus on the Business Question You Care About
If you already know what you want to investigate, add an optional analysis requirement. For example, ask Smart Pivot to focus on high sales records, compare performance by region, or summarize results by product category.
Save Time on Repetitive Report Building
Smart Pivot is useful for recurring analysis tasks, such as reviewing sales records, order lists, inventory tables, customer data, or performance reports. It helps you get from data to insight faster without setting up every analysis layout manually.
How to Use Smart Pivot
Before you start, make sure ZKutools Anywhere for Excel is available in your Excel. Get it from Microsoft AppSource if needed.
Note: Smart Pivot is one of the AI features in ZKutools Anywhere for Excel. AI features require a ZKutools AI account. You can start with 200,000 free tokens, and then continue with one ZKutools AI subscription for Excel, Outlook, and Word.
Step 1: Open ZKutools Anywhere for Excel
- Open your Excel workbook, and click ZKUTOOLS > Smart Pivot to open the ZKutools Anywhere for Excel panel.
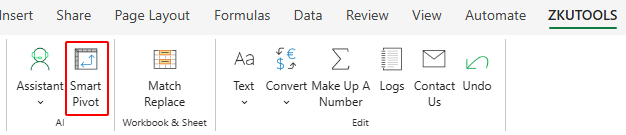
- After the ZKutools Anywhere pane opens, sign in with your ZKutools AI account. If you do not have one yet, you can create one from the pane.
Step 2: Use Smart Pivot
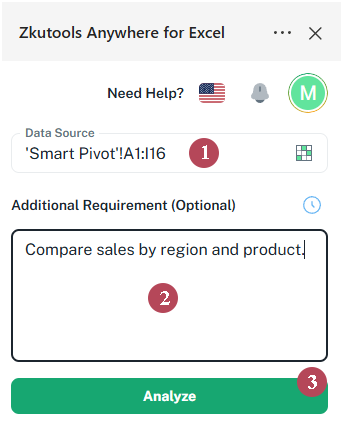
- In the Smart Pivot interface, click the range selector icon and choose the table or range you want to analyze.
- In the Additional Requirement box, optionally enter a focus for the analysis. If you leave it blank, Smart Pivot can still recommend suitable schemes based on the selected data source. To guide the analysis, you can enter requirements such as:
- Compare sales by region and product.
- Analyze quantity sold by category.
- Summarize average sales per order.
- Click the Analyze button.
Step 3: Review the Recommended Analysis Schemes
Smart Pivot will start reviewing your data source and generating recommended analysis schemes. During this process, you may see a message such as Analyzing data, please wait.... After the analysis is complete, Smart Pivot displays Recommended Analysis Schemes. These schemes may be grouped into categories such as Cross Analysis, Trend Analysis, and Summary Statistics.
Review the list and look for the analysis that best matches your reporting goal. 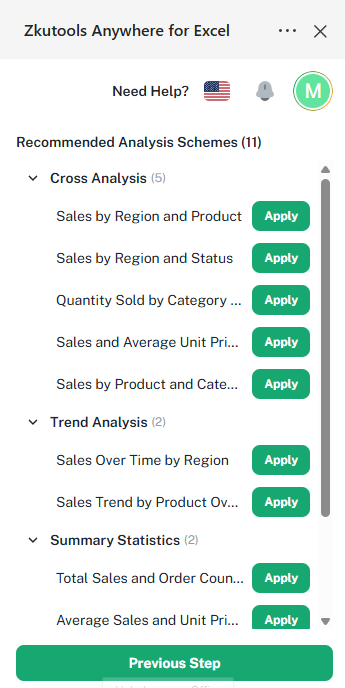
Result: Apply the Scheme You Want
Click the Apply button next to the recommended scheme you want to use. Smart Pivot will generate a new worksheet named after the selected scheme, with the PivotTable created inside it.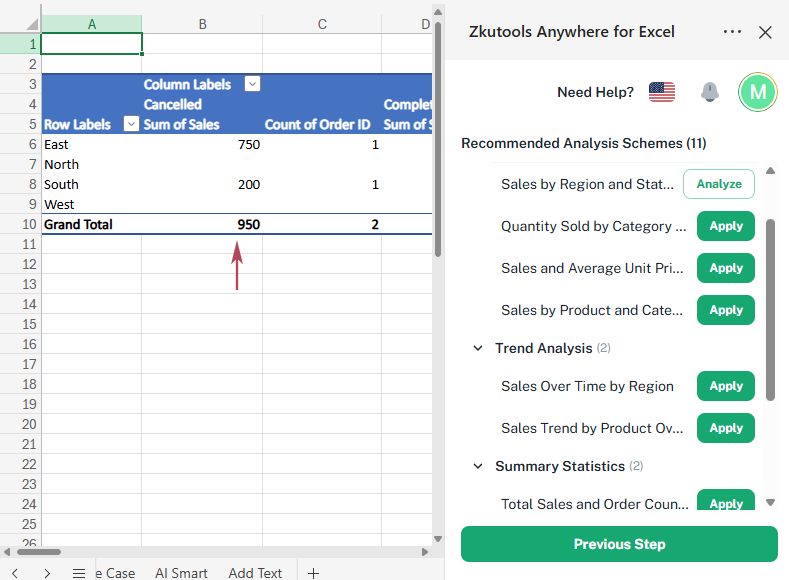
- If the recommended schemes are not what you need, click Previous Step to go back, adjust the data source or enter a more specific requirement, and then analyze again.
- After you click Apply for a recommended scheme, the button changes to Analyze. Click Analyze to let AI further interpret the PivotTable result. The analysis will be inserted as a text box next to the PivotTable.
Guide the Analysis with Your Own Requirement
The Additional Requirement box is useful when you want Smart Pivot to focus on a specific question. You do not need to write a long prompt. A short instruction is enough as long as it tells the AI what kind of analysis you want.
You can leave this box blank when you simply want Smart Pivot to explore the dataset and suggest report ideas. Add a requirement when you already know your goal, such as comparing sales, summarizing performance, or focusing on a subset of records.
| What You Want to Analyze | Requirement You Can Enter | What Smart Pivot May Recommend |
|---|---|---|
| Regional performance | Compare total sales by region. | A comparison report by region |
| Product performance | Analyze sales and quantity by product. | A cross analysis by product |
| High-value records | Focus on records with sales over 1000. | Schemes focused on high-value orders |
| Order summary | Summarize average sales per order. | A summary statistics report |
| Time-based trend | Analyze sales trends by order date. | A date-based analysis suggestion |
Tip: If you are exploring the data for the first time, leave the Additional Requirement box blank. If you already have a question in mind, add a short requirement to make the recommendations more focused.
How Recommended Analysis Schemes Work
Recommended Analysis Schemes are AI-generated report suggestions based on your selected data source and optional requirement. They help you decide how to summarize, compare, or explore trends in your data without building every PivotTable layout manually.
| Scheme Group | What It Means | Example |
|---|---|---|
| Cross Analysis | Summarizes values across two or more fields to reveal relationships between categories. | Sales by Region and Product |
| Trend Analysis | Analyzes how values change over time, helping you identify patterns, growth, or declines. | Sales Trend by Order Date |
| Summary Statistics | Creates high-level summaries such as averages, totals, counts, or other key statistics. | Average Sales per Order |
The groups and scheme names may vary depending on your dataset. Review the recommended list, choose the report idea that best answers your question, and click Apply.
Frequently Asked Questions
Is Smart Pivot free to use?
Smart Pivot is an AI feature and requires a ZKutools AI account. You can start with 200,000 free tokens, and then continue with one ZKutools AI subscription for Excel, Outlook, and Word.
Do I need to know PivotTables before using Smart Pivot?
No. Smart Pivot is designed to help you discover and apply analysis schemes more easily. However, basic PivotTable knowledge can still help you review the result and adjust it if needed.
Can I leave the Additional Requirement box blank?
Yes. The Additional Requirement box is optional. You can leave it blank and let Smart Pivot recommend analysis schemes based on the selected data source.
What kind of data works best with Smart Pivot?
Smart Pivot works best with structured data that has clear headers and consistent rows, such as sales records, order lists, product tables, inventory data, and customer records.
What can I do if the recommended schemes are not suitable?
Click Previous Step, adjust the data source, enter a clearer Additional Requirement, and then click Analyze again.
Do I still need to check the analysis result?
Yes. Always review the applied result to make sure it matches your data source, business question, and reporting needs.
Conclusion
Smart Pivot in ZKutools Anywhere for Excel helps you analyze Excel data faster by turning a selected data source into AI-recommended PivotTable-style report ideas. Instead of spending time deciding which fields to place in a PivotTable, you can review suggested schemes and apply the one that fits your goal.
Whether you want to compare sales, summarize orders, analyze product performance, or explore trends, Smart Pivot gives you a faster way to discover useful insights from your worksheet data.
Turn Excel Tasks into Results Faster
With ZKutools Anywhere for Excel, you can use AI directly in Excel to help with formulas, data processing, and everyday worksheet tasks — without switching between different tools.
Start with 200,000 free AI tokens, then continue with one ZKutools AI subscription for Excel, Outlook, and Word.