How to create a control chart in Excel?
Control chart, also known as Shewhart chart or process-behavior chart, is widely used to determine if a manufacturing or business process is in a state of statistical control. This tutorial introduces the detailed steps about creating a control chart in Excel.
Create a control chart in Excel
 Create a control chart in Excel
For example, you have below base data needed to create a control chart in Excel
.
Now please follow the steps to finish a control chart.
1. Firstly, you need to calculate the mean (average) and standard deviation. Select a blank cell next to your base data, and type this formula =AVERAGE(B2:B32), press Enter key and then in the below cell, type this formula =STDEV.S(B2:B32), press Enter key.
Note: In Excel 2007, please enter this formula =STDEV(B2:B32) to calculate the standard Deviation. In the above formulas, B2: B32 is the base data range.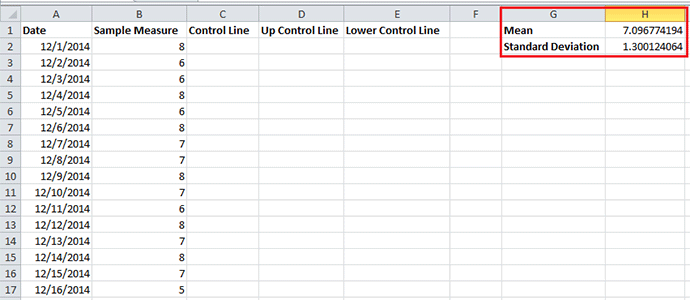
2. Then go to the Control Line column, and in the first cell below the header, cell C2, type this formula =$H$1 (cell $H$1 is the average result), and drag the fill handle to fill the data range you need.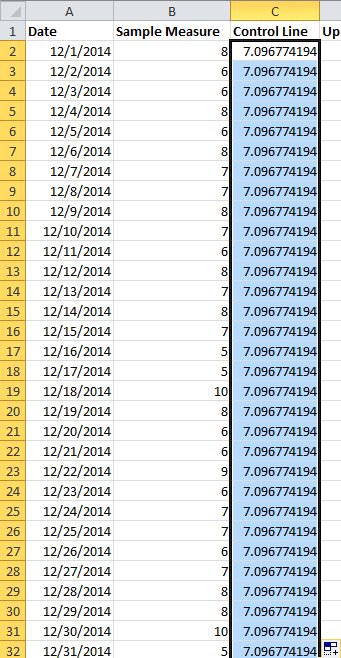
3. In the first cell below Up Control Line column, cell D2, type this formula =$H$1+($H$2*3) ($H$1 is the average result and $H$2 is the standard deviation result), then drag the auto fill handle to the range you need.
4. Under Below Control Line column, type =$H$1-($H$2*3) ($H$1 is the average result and $H$2 is the standard deviation result), then drag the auto fill handle to the range you need.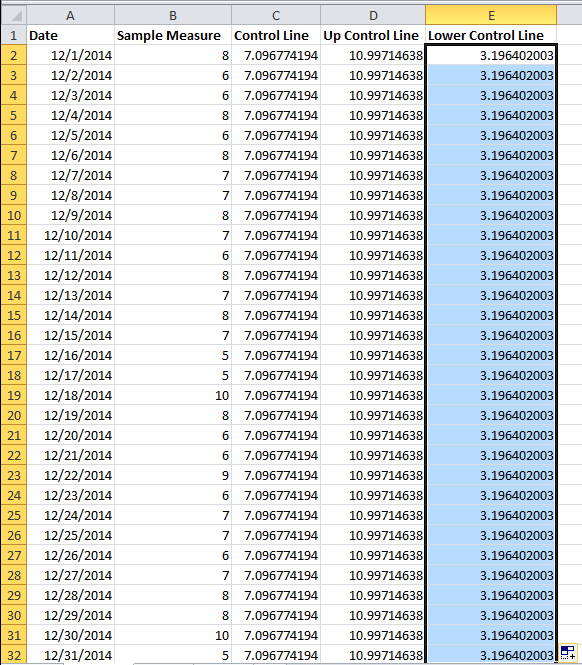
Now you can insert a chart.
5. Select Date and Sample Measure columns and click Insert > Line > Line to insert a line chart. See screenshot:
6. Then right click on the line chart and click Select Data from context menu.
7. In the Select Data Source dialog, click Add button, then in the Edit Series dialog, select Control Line as the Series Name, and select the relative data into the Series values text box.
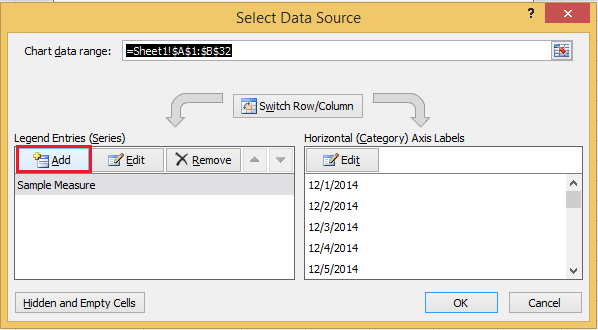

8. Click OK, then repeat step 7 to add Up Control Line and Lower Control Line as the series in the Legend Entries (Series) section.
9. Click OK to exit the dialog, now a control chart is created.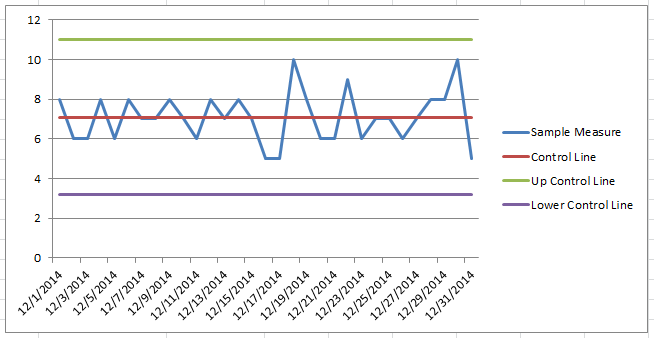
Advanced Charts Tool
|
| The Charts Tool in Kutools for Excel provides some usually used but difficult creating charts, which only need to click click click, a standard chart has been created. More and more charts are going to included in Charts Tool.. Click for full-featured 30 days free trial! |
 |
| Kutools for Excel: with more than 300 handy Excel add-ins, free to try with no limitation in 30 days. |
Relative Articles:
- Create flowchart in Excel
- Create thermometer chart in Excel
- Create smiley face chart in Excel
- Create milestone chart in Excel
Best Office Productivity Tools
Supercharge Your Excel Skills with Kutools for Excel, and Experience Efficiency Like Never Before. Kutools for Excel Offers Over 300 Advanced Features to Boost Productivity and Save Time. Click Here to Get The Feature You Need The Most...
")
Office Tab Brings Tabbed interface to Office, and Make Your Work Much Easier
- Enable tabbed editing and reading in Word, Excel, PowerPoint, Publisher, Access, Visio and Project.
- Open and create multiple documents in new tabs of the same window, rather than in new windows.
- Increases your productivity by 50%, and reduces hundreds of mouse clicks for you every day!
")