How to calculate running total /average in Excel?
For example, you have a sales table in Excel, and you want to get the sale sums/totals of every day, how could you get it done in Excel? And what if calculating the running average on every day? This article will guide you to apply formulas to calculate the running total and running average in Excel with ease.
- Calculate running sum/total or running average with formula in Excel
- Calculate running sum/total with Pivot Table in Excel
Calculate running SUM or running average with formula in Excel
We can apply a formula to calculate the running sums or running totals easily in Excel as follows:
1. Besides the Amount column, type Running SUM or Running Average in Cell D1.
2. Enter the formula =SUM($D$3:D3) into the Cell E3, and press the Enter key.

Tips: If you need to calculate the running average, use this formula: =AVERAGE($D$3:D3)
3. Keep the formula cell selected, and drag its AutoFill Handle to apply the formula to other cells.
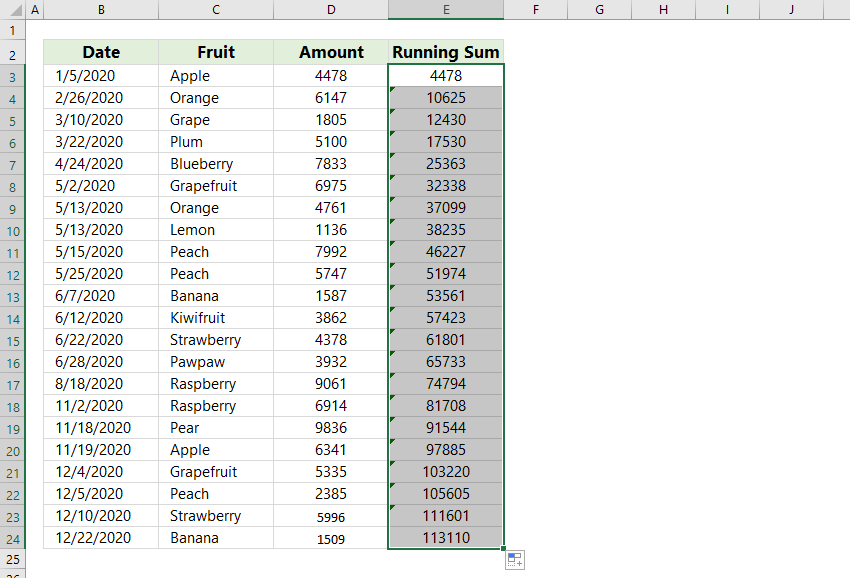
Now you will get all running sums/totals or running averages in the specific column.
One click to add a running sum line & labels for a cluster column chart
The cluster column chart is quite common and useful in statistic works. Now, Kutools for Excel releases a chart tool – Add Cumulative Sum to Chart to quickly add a cumulative total line and all cumulative total labels for a cluster column chart by only one click!
Kutools for Excel - Supercharge Excel with over 300 essential tools. Enjoy a full-featured 30-day FREE trial with no credit card required! Get It Now
Calculate running SUM with Pivot Table in Excel
Apart from the above formula, we can also calculate running sums or running totals with Pivot Table in Excel. And you can get it done as follows:
1.Select original table, and then click the Insert > PivotTable.

2. In the opening Create PivotTable dialog box, check the Existing Worksheet option, then select a cell in current worksheet to locate the Pivot table in the Location box, and click the OK button.

Note: If you want to place the pivot table into a new worksheet, please check the New Worksheet option.
3. In the coming PivotTable Fields pane, drag the Date field from Choose fields to add to report box to the Rows box, and drag Amount field to the Values box (or you can just check these two boxes to show them in the ROWS and VALUES boxes). See below screen shot:

4. Right click the Sum of Amount in the Pivot Table, and then select Show Value As > Running Total IN in the right-clicking menu. See screen shot above:
5. In the popping out Show Values As dialog box, click the Base Filed box and specify a filed from the drop down list, and then click the OK button.

Note: In Excel 2007, right click the Sum of Amount in the Pivot Table and then select Value Field Settings from the right-clicking menu; next in the Value Field Setting dialog box click the Show Value as tab, then click the Show Value as box and select the Running Total in from the drop down list, and at last click the OK button. See below screen shot:

Then you will get all running sums or running totals in the pivot table at once.
Related articles:
Best Office Productivity Tools
Supercharge Your Excel Skills with Kutools for Excel, and Experience Efficiency Like Never Before. Kutools for Excel Offers Over 300 Advanced Features to Boost Productivity and Save Time. Click Here to Get The Feature You Need The Most...
")
Office Tab Brings Tabbed interface to Office, and Make Your Work Much Easier
- Enable tabbed editing and reading in Word, Excel, PowerPoint, Publisher, Access, Visio and Project.
- Open and create multiple documents in new tabs of the same window, rather than in new windows.
- Increases your productivity by 50%, and reduces hundreds of mouse clicks for you every day!
")