How to calculate Make-or-Buy decisions in Excel?
Make a kind of accessory by yourself, or buy it from other manufactories? Normally we have to compare costs of making and buying before making decisions. Here I will guide you to process Make vs Buy analysis, and make the make-or-buy decision in Excel easily.
Calculate Make-or-Buy decisions in Excel
 Calculate Make-or-Buy decisions in Excel
To calculate or evaluate the make-or-buy decision in Excel, you can do as following:
Step 1: Prepare a table as the following screen shot shown, and enter your data into this table.

Step 2: Calculate the making cost and total buying cost:
(1) In Cell D3 enter =A3*C3+B3, and drag the Fill Handle to the range you need. In Our case, we drag the Fill Handle to the Range D4:D12;
(2) In Cell E3 enter =D3/A3, and drag the Fill Handle to the range you need. In Our case, we drag the Fill Handle to the Range E4:E12;
(3) In Cell G3 enter =F3*A3, and drag the Fill Handle to the range you need. In Our case, we drag the Fill Handle to the Range G4:G12.
Up to now, we have finished the Make VS Buy table in Excel.
Step 3: Then we will insert a scatter chart.
(1) Holding the Ctrl key, and select the Units column (Range A2:A12), Unit Cost of Making column (Range E2:E12), and Unit Cost of Buying column (Range F2:F12);
(2) Click the Insert > Scatter button (or Insert Scatter (X,Y) or Buddle Chart button) > Scatter with Smooth Lines. See screen shot below:

Step 4: Format the vertical axis with right clicking the vertical axis and selecting the Format Axis from the right-clicking menu.

Step 5: Change the vertical axis options as following:
- In Excel 2013' Format Axis pane, enter min bound in the Minimum box, and enter max bound in the Maximum box;
- In Excel 2007 and 2010's Format Axis dialog box, check the Fixed option behind the Minimum and enter min bound into following box; check the Fixed option behind the Maximum and enter max bound into following box; then close the dialog box. See screen shot below:
Excel 2013 and higher versions:
Excel 2010:
Step 6: Change the horizontal axis option with the same method we introduced in Step 5.
Step 7: Keep selecting the chart, and then click the Layout > Chart Title > Above Chart, and then type a chart name.

Note: In Excel 2013, the chart name is added above the chart by default. You just need to change the chart name as you need.
Step 8: Change the position of legends with clicking the Layout > Legend > Show Legend at Bottom.
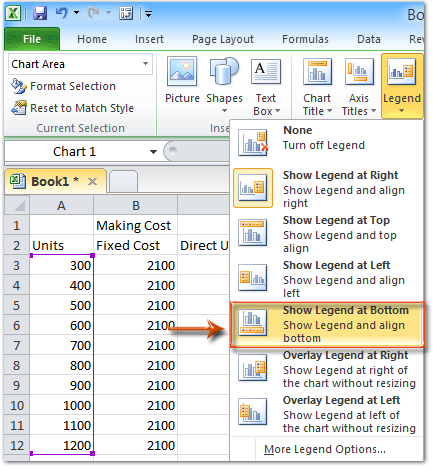
Note: In Excel 2013, the legend is added at bottom by default.
Up to present, we have created the Make vs Buy table and Make vs Buy chart already. And we can make make-vs-buy decision easily with the chart.
In our case, if we need less than 1050 units, it's economic to buy the accessory; if we need more than 1050 units, making the accessory will cost less; if we need 700 units or 1050 units, making costs the same money as buying. See screen shot below:

Best Office Productivity Tools
Supercharge Your Excel Skills with Kutools for Excel, and Experience Efficiency Like Never Before. Kutools for Excel Offers Over 300 Advanced Features to Boost Productivity and Save Time. Click Here to Get The Feature You Need The Most...
Office Tab Brings Tabbed interface to Office, and Make Your Work Much Easier
- Enable tabbed editing and reading in Word, Excel, PowerPoint, Publisher, Access, Visio and Project.
- Open and create multiple documents in new tabs of the same window, rather than in new windows.
- Increases your productivity by 50%, and reduces hundreds of mouse clicks for you every day!
All Kutools add-ins. One installer
Kutools for Office suite bundles add-ins for Excel, Word, Outlook & PowerPoint plus Office Tab Pro, which is ideal for teams working across Office apps.
- All-in-one suite — Excel, Word, Outlook & PowerPoint add-ins + Office Tab Pro
- One installer, one license — set up in minutes (MSI-ready)
- Works better together — streamlined productivity across Office apps
- 30-day full-featured trial — no registration, no credit card
- Best value — save vs buying individual add-in