Note: The other languages of the website are Google-translated. Back to English

How to highlight cell based on adjacent cell value in Excel?

If you need to highlight cell where adjacent cell is equal to or greater than it, of course, you can compare them one by one, but, are there any good and quick methods for solving the job in Excel?

Highlight cells if equal to adjacent cells

Highlight cells if equal or not equal to adjacent cells with Kutools for Excel

Highlight cells if greater or less than adjacent cells


Highlight cells if equal to adjacent cells

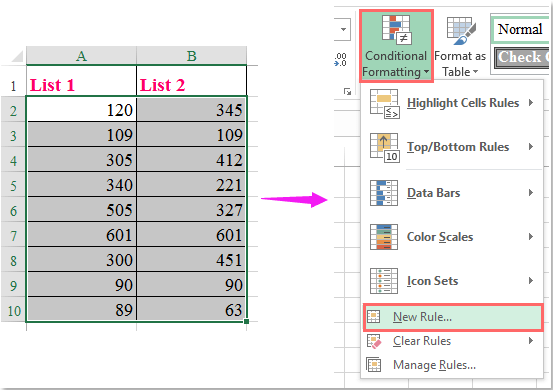
Let’s say, when you want to highlight the cell if adjacent cell is equal to it, the Conditional Formatting feature can do you a favor, please do as follows:

1. Select the cells that you want to highlight cells if they are equal to adjacent cells, and then click Home > Conditional Formatting > New Rule, see screenshot:

doc highlight based on adjacent 1

2. In the New Formatting Rule dialog box, click Use a formula to determine which cells to format in the Select a Rule Type list box, and then enter this formula: =$A2=$B2 into the Format value where this formula is true text box, see screenshot:

doc highlight based on adjacent 2

3. Then click Format button to go to the Format Cells dialog, under the Fill tab, please specify a color you like to use, see screenshot:

doc highlight based on adjacent 3

4. And then click OK > OK to close the dialogs, and the cells which are equal to the adjacent cells have been highlighted at once, see screenshot:

doc highlight based on adjacent 4


Highlight cells if equal or not equal to adjacent cells with Kutools for Excel

If you have Kutools for Excel, with its Compare Cells utility, you can quickly compare two columns and find or highlight the same or different values for each row.

Kutools for Excel : with more than 300 handy Excel add-ins, free to try with no limitation in 30 days. 

After installing Kutools for Excel, please do as this:

1. Click Kutools > Compare Cells, see screenshot:

2. In the Compare Cells dialog box, please do the following operations:

  • (1.) Select the two columns from the Find values in and According to text box separately;
  • (2.) Choose Same cells to select the cells equal to adjacent cell;
  • (3.) At last, please specify a cell color or font color you need to highlight the cells.
  • (4.) And all cells which equal to adjacent cells have been highlighted at once.

doc highlight based on adjacent 10

3. To highlight the cells which not equal to adjacent cell values, please choose Different cells in the Compare Cells dialog box, and you will get the following result as you need.

doc highlight based on adjacent 11

Click Download and free trial Kutools for Excel Now !


Demo: Highlight cells if equal or not equal to adjacent cells with Kutools for Excel

Kutools for Excel: with more than 300 handy Excel add-ins, free to try with no limitation in 30 days. Download and free trial Now!

Highlight cells if greater or less than adjacent cells

To highlight the cells if greater or less than adjacent cells, please do as this:

1. Select the cells that you want to use, and then click Home > Conditional Formatting > New Rule, in the New Formatting Rule dialog box, do the following operations:

(1.) Click Use a formula to determine which cells to format from the Select a Rule Type list box;

(2.) Enter this formula: =$A2>$B2 (greater than adjacent cell) or =$A2<$B2 (less than adjacent cell) into the Format values where this formula is true text box.

doc highlight based on adjacent 5

2. Then click Format button to go to the Format Cells dialog box, and choose a color to highlight the cells you want under the Fill tab, see screenshot:

doc highlight based on adjacent 6

3. Then click OK > OK buttons to close the dialogs, and now, you can see the cells in column A which are greater than adjacent cells have been highlighted as you need.

doc highlight based on adjacent 7


The Best Office Productivity Tools

Kutools for Excel Solves Most of Your Problems, and Increases Your Productivity by 80%

  • Reuse: Quickly insert complex formulas, charts and anything that you have used before; Encrypt Cells with password; Create Mailing List and send emails...
  • Super Formula Bar (easily edit multiple lines of text and formula); Reading Layout (easily read and edit large numbers of cells); Paste to Filtered Range...
  • Merge Cells/Rows/Columns without losing Data; Split Cells Content; Combine Duplicate Rows/Columns... Prevent Duplicate Cells; Compare Ranges...
  • Select Duplicate or Unique Rows; Select Blank Rows (all cells are empty); Super Find and Fuzzy Find in Many Workbooks; Random Select...
  • Exact Copy Multiple Cells without changing formula reference; Auto Create References to Multiple Sheets; Insert Bullets, Check Boxes and more...
  • Extract Text, Add Text, Remove by Position, Remove Space; Create and Print Paging Subtotals; Convert Between Cells Content and Comments...
  • Super Filter (save and apply filter schemes to other sheets); Advanced Sort by month/week/day, frequency and more; Special Filter by bold, italic...
  • Combine Workbooks and WorkSheets; Merge Tables based on key columns; Split Data into Multiple Sheets; Batch Convert xls, xlsx and PDF...
  • More than 300 powerful features. Supports Office / Excel 2007-2021 and 365. Supports all languages. Easy deploying in your enterprise or organization. Full features 30-day free trial. 60-day money back guarantee.
kte tab 201905

Office Tab Brings Tabbed interface to Office, and Make Your Work Much Easier

  • Enable tabbed editing and reading in Word, Excel, PowerPoint, Publisher, Access, Visio and Project.
  • Open and create multiple documents in new tabs of the same window, rather than in new windows.
  • Increases your productivity by 50%, and reduces hundreds of mouse clicks for you every day!
officetab bottom
Comments (8)
No ratings yet. Be the first to rate!
This comment was minimized by the moderator on the site
need help with creating a formula. I have a spreadsheet that has a list of names in one column(s) (for example, column's A and C and in the column beside it (columns's B and D) they have a "x" in the cell if they meet certain criteria. I want to be able highlight all the cells in columns A and C that have a X beside them.

Thanks for any and all help.

~Ramy Jo
This comment was minimized by the moderator on the site
Hello, Ramy,
To solve your problem, please select the column A first, and then use this formula: =$B2="x" into the Conditional Formatting, you will higlight the corresponding cells for column A, see screenshot:
https://www.extendoffice.com/images/stories/comments/comment-skyyang/doc-highlight-cells-1.png

After highlighting the cells in column A, go on apply this formula:=$D2="x" to highlight the cells in column C.
Please try, hope it can help you!
This comment was minimized by the moderator on the site
I have a worksheet with many rows and columns.

The columns are dates, and the row is numbers,

I want to highlight cells that are either greater than or less than the cell on its left, for the entire workbook.
This comment was minimized by the moderator on the site
Добрый день. Помогите, пожалуйста! С помощью Условного форматирования можно выделить цветом ячейки с цифрами Между, например между 5 и 7 выделится ячейка с цифрой 6. А как сделать то же самое с текстом?
Например чтоб в столбце между ячейками с текстом Имя и Город рождения выделились все ячейки с любыми значениями.
Заранее спасибо
This comment was minimized by the moderator on the site
Hello,
Sorry, I can't understand you clearly, could you explain your problem in English detailedly?
Thank you!
This comment was minimized by the moderator on the site
I hope the translator will not let me down.
I have a large table with data in the column:
Name 1 (text)
1
2
3
..
Name 2 (text)
1
2
3
..
Name 3 (text)...
from this table, I need to extract the data between Name 1 and Name 2, they are repeated several thousand times. How do I highlight data between text cells/rows?
Please help.
This comment was minimized by the moderator on the site
Good afternoon. There is a table where the column has values​: text and data for it. I only need to create a new table with Name 1.
How to do this?
Thank you.

Name 1 (text)
3
7
2
Name 2 (text)
2
14
3
Name 3 (text)
40
1
7
Name 1 (text)
1
7
Name 2 (text)
7
5
There are no comments posted here yet

Follow Us

Copyright © 2009 - www.extendoffice.com. | All rights reserved. Powered by ExtendOffice. | Sitemap
Microsoft and the Office logo are trademarks or registered trademarks of Microsoft Corporation in the United States and/or other countries.
Protected by Sectigo SSL