Power Query: If statement - nested ifs & multiple conditions
In Excel Power Query, the IF statement is one of the most popular functions to check a condition and return a specific value depending on whether the result is TRUE or FALSE. There are some differences between this if statement and the IF function of Excel. In this tutorial, I will introduce the syntax of this if statement and some simple and complex examples for you.
Basic if statement syntax of Power Query
Power Query if statement using a conditional column
Power Query if statement by writing the M code
Basic if statement syntax of Power Query
In Power Query, the syntax is:
- logical_test: The condition you want to test.
- value_if_true: The value to return if the result is TRUE.
- value_if_false: The value to return if the result is FALSE.
In Excel Power Query, there are two ways to create this type of conditional logic:
- Using the Conditional Column feature for some basic scenarios;
- Writing M code for more advanced scenarios.
In the following section, I will talk about some examples for using this if statement.
Power Query if statement using a conditional column
Example 1: Basic if statement
Here, I will introduce how to use this if statement in Power Query. For example, I have a following product report, if the product status is Old, displaying a 50% discount; if the product status is New, displaying a 20% discount as below screenshots shown.

1. Select the data table from the worksheet, then, in Excel 2019 and Excel 365, click Data > From Table/Range, see screenshot:

Note: In Excel 2016 and Excel 2021, click Data > From Table, see screenshot:

2. Then, in the opened Power Query Editor window, click Add Column > Conditional Column, see screenshot:

3. In the popped out Add Conditional Column dialog, please do the following operations:
- New Column Name: Enter a name for the new column;
- Then, specify the criteria you need. For instance, I will specify If Status equals Old then 50% else 20%;
- Column Name: The column to evaluate your if-condition against. Here, I select Status.
- Operator: Conditional logic to use. The options will differ depending on the data type of the selected Column Name.
- Text: begins with, does not begin with, equals, contains, etc.
- Numbers: equals, does not equal, is bigger than or equal to, etc.
- Date: is before, is after, is equal to, does not equal, etc.
- Value: The specific value to compare your evaluation against. It together with the Column Name and Operator makes up a condition.
- Output: The value to return if the condition is met.
- Else: Another value to return when the condition is false.

4. Then, click OK button to get back to the Power Query Editor window. Now, a new Discount column is added, see screenshot:

5. If you want to format the numbers to percentage, just click ABC123 icon from the Discount column header, and choose Percentage as you need, see screenshot:

6. Finally, please click Home > Close & Load > Close & Load to load this data to a new worksheet.

Example 2: Complex if statement
With this Conditional Column option, you can also insert two or more conditions into the Add Conditional Column dialog. Please do as this:
1. Select the data table, and go to the Power Query Editor window by clicking Data > From Table/Range. In the new window, click Add Column > Conditional Column.
2. In the popped out Add Conditional Column dialog box, please do the following operations:
- Enter a name for the new column into the New column name textbox;
- Specify the first criteria into the first criteria field, and then click Add Clause button to add other criteria fields as you need.

3. After finishing the criteria, click OK button to get back to the Power Query Editor window. Now, you will get a new column with the corresponding result you need. See screenshot:

4. At last, please click Home > Close & Load > Close & Load to load this data to a new worksheet.
Power Query if statement by writing the M code
Normally, Conditional Column is helpful for some basic scenarios. Sometimes, you may need to use multiple conditions with AND or OR logic. In this case, you must write M code inside a Custom Column for more complex scenarios.
Example 1: Basic if statement
Take the first data as example, if the product status is Old, displaying a 50% discount; if the product status is New, displaying a 20% discount. For writing the M code, please do as this:
1. Select the table, and click Data > From Table/Range to go to the Power Query Editor window.
2. In the opened window, click Add Column > Custom Column, see screenshot:

3. In the popped out Custom Column dialog box, please do the following operations:
- Enter a name for the new column into the New column name textbox;
- Then, input this formula: if [Status] = "Old " then "50% " else "20% " into the Custom column formula box.

4. Then, click OK to close this dialog box. Now, you will get the following result as you need:

5. At last, click Home > Close & Load > Close & Load to load this data to a new worksheet.
Example 2: Complex if statement
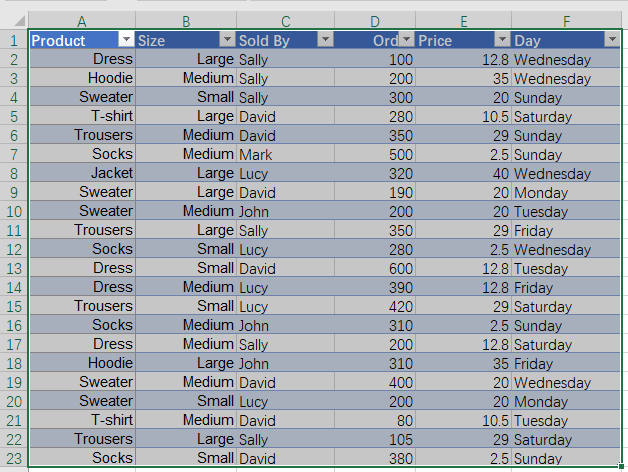
Usually, to test the sub-conditions, you can nest multiple if statements. For example, I have the below data table. If the product is “Dress”, give a 50% discount for the original price; if the product is “Sweater” or “Hoodie”, give a 20% discount for the original price; and other products keep the original price.
1. Select the data table, and click Data > From Table/Range to go to the Power Query Editor window.
2. In the opened window, click Add Column > Custom Column. In the opened Custom Column dialog box, please do the following operations:
- Enter a name for the new column into the New column name textbox;
- Then, input the below formula into the Custom column formula box.
- = if [Product] = "Dress" then [Price] * 0.5 else
if [Product] = "Sweater" then [Price] * 0.8 else
if [Product] = "Hoodie" then [Price] * 0.8
else [Price]

3. And then, click OK button to go back to the Power Query Editor window, and you will get a new column with the data you need, see screenshot:

4. At last, click Home > Close & Load > Close & Load to load this data to a new worksheet.
The OR logic performs multiple logical tests, and the true result will return if any of the logical tests is true. The syntax is:
Supposing, I have the below table, now, I want a new column display as: if the product is “Dress” or “T-shirt”, then the brand is “AAA”, the brand of other products is “BBB”.

1. Select the data table, and click Data > From Table/Range to go to the Power Query Editor window.
2. In the opened window, click Add Column > Custom Column, in the opened Custom Column dialog box, please do the following operations:
- Enter a name for the new column into the New column name textbox;
- Then, input the below formula into the Custom column formula box.
- = if [Product] = "Dress" or [Product] = "T-shirt" then "AAA"
else "BBB"

3. And then, click OK button to go back to the Power Query Editor window, and you will get a new column with the data you need, see screenshot:

4. Finally, click Home > Close & Load > Close & Load to load this data to a new worksheet.
The AND logic performs multiple logical tests inside a single if statement. All the tests must be true for the true result to be returned. If any of the tests is false, the false result is returned. The syntax is:
Take the above data as an example. I want a new column to display: if the product is “Dress” and the order is greater than 300, then apply a 50% discount to the original price; otherwise, keep the original price.
1. Select the data table, and click Data > From Table/Range to go to the Power Query Editor window.
2. In the opened window, click Add Column > Custom Column. In the opened Custom Column dialog box, please do the following operations:
- Enter a name for the new column into the New column name textbox;
- Then, input the below formula into the Custom column formula box.
- = if [Product] ="Dress" and [Order] > 300 then [Price]*0.5
else [Price]

3. Then, click OK button to go back to the Power Query Editor window, and you will get a new column with the data you need, see screenshot:

4. Finally, you should load this data into a new worksheet by clicking Home > Close & Load > Close & Load.
If statement with OR and AND Logics
Alright, the previous examples are easy for us to understand. Now, let’s make it harder. You can combine AND and OR to form any condition you can imagine. In this type, you can use brackets into the formula to define complex rules.
Take the above data as an example as well, assume I want a new column displays as: if the product is “Dress” and its order is greater than 300, or the product is “Trousers” and its order greater than 300, then show “A+”, else, display “Other”.
1. Select the data table, and click Data > From Table/Range to go to the Power Query Editor window.
2. In the opened window, click Add Column > Custom Column. In the opened Custom Column dialog box, please do the following operations:
- Enter a name for the new column into the New column name textbox;
- Then, input the below formula into the Custom column formula box.
- =if ([Product] = "Dress" and [Order] > 300 ) or
([Product] = "Trousers" and [Order] > 300 )
then "A+"
else "Other"

3. Then, click OK button to go back to the Power Query Editor window, and you will get a new column with the data you need, see screenshot:

4. Finally, you should load this data into a new worksheet by clicking Home > Close & Load > Close & Load.
In the Custom column formula box, you can use the following logical operators:
- = : Equals
- <> : Not equal to
- > : Greater than
- >= : Greater than or equal to
- < : Less than
- <= : Less than or equal to
Best Office Productivity Tools
Supercharge Your Excel Skills with Kutools for Excel, and Experience Efficiency Like Never Before. Kutools for Excel Offers Over 300 Advanced Features to Boost Productivity and Save Time. Click Here to Get The Feature You Need The Most...
Office Tab Brings Tabbed interface to Office, and Make Your Work Much Easier
- Enable tabbed editing and reading in Word, Excel, PowerPoint, Publisher, Access, Visio and Project.
- Open and create multiple documents in new tabs of the same window, rather than in new windows.
- Increases your productivity by 50%, and reduces hundreds of mouse clicks for you every day!
All Kutools add-ins. One installer
Kutools for Office suite bundles add-ins for Excel, Word, Outlook & PowerPoint plus Office Tab Pro, which is ideal for teams working across Office apps.
- All-in-one suite — Excel, Word, Outlook & PowerPoint add-ins + Office Tab Pro
- One installer, one license — set up in minutes (MSI-ready)
- Works better together — streamlined productivity across Office apps
- 30-day full-featured trial — no registration, no credit card
- Best value — save vs buying individual add-in