How to add vertical/average line to bar chart in Excel?
When working with bar charts in Excel to visually represent your data, you may encounter scenarios where it is necessary to accentuate the average value - helping viewers to better understand how individual data points compare to the overall mean. By adding a vertical line representing the average directly on the bar chart, as demonstrated in the screenshot below, you enhance the clarity and interpretability of your chart for presentations, reports, and decision-making. This tutorial details multiple methods for adding a vertical or average line to a bar chart in Excel, ranging from built-in chart techniques to automated VBA macros.

Add vertical line to bar chart
VBA code solution: Add vertical/average line programmatically
 Add vertical line to bar chart
To begin, ensure you have your data prepared and ready for visualization in a bar chart format.
1. Select your data range, then go to Insert > Bar > Bar. This creates the foundational bar chart based on your dataset.


2. Move to an unused area on your worksheet, for example, cell A10. Enter Y in this cell, and type X in the adjacent cell (B10). This setup helps establish the foundation for plotting the average line.

3. Enter 0 and 1 into the two cells directly beneath the Y cell (A11 and A12), forming a vertical data series to support the average line. This step is critical to ensure the vertical orientation of the line when plotted.

4. In the cell below X (B11), input the formula =AVERAGE($B$2:$B$9), with $B$2:$B$9 representing your actual data range. Press Enter, then drag the fill handle down to the cell beneath (B12) to copy the formula. This duplicates the average value for both points that the line will be anchored to.
Tips: Double-check the cell references used in your formula, especially if your data is not in column B or starts at different rows.

5. Right-click anywhere on the bar chart and select Select Data from the context menu. This step is necessary to bring the average line data into the chart.

6. In the Select Data Source dialog, click the Add button under Legend Entries (Series). This lets you insert a new series specifically for your average line.

7. Within the Edit Series dialog that opens, assign an appropriate series name and specify B11:B12 as your series values (or adjust as necessary if your average calculation is elsewhere).

8. Click OK twice to close the dialogs and return to the worksheet. Now click on the newly added series within the bar chart, right-click, and choose Change Series Chart Type to update its display format.

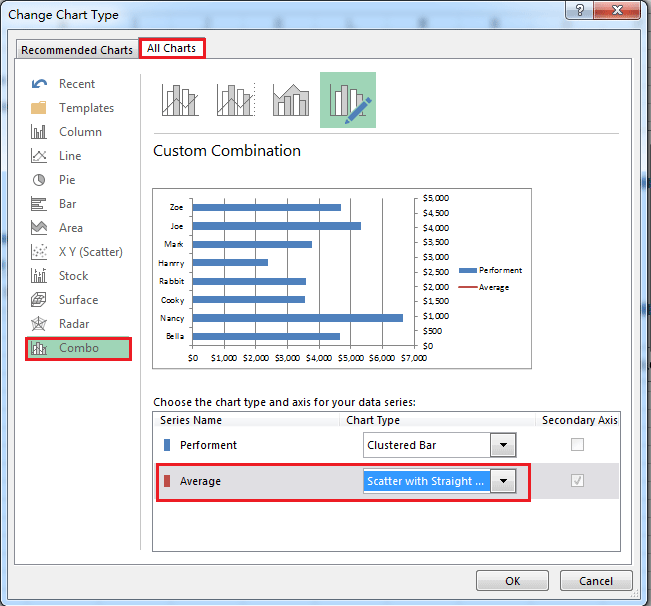
9. In the Change Chart Type window, pick X Y (Scatter) > Scatter with Straight Lines. Click OK to apply and exit this dialog.
Note: In Excel 2013 and newer, select the Combo section under All Charts, then apply Scatter with Straight Lines to your average series.

10. Return to the chart and right-click to select Select Data from the context menu again.
11. In the Select Data window, select the Average series and click Edit to define the X and Y values more precisely.

12. In the Edit Series dialog, input the ranges for your X and Y values (typically the two cells below your X and Y labels). If you have modified any locations, ensure the references match your worksheet’s setup.

13. After clicking OK in the dialogs, right-click the secondary (right side) Y axis, and select Format Axis.

14. Within the Format Axis dialog, check the Fixed option next to Maximum and set the value to 1. This forces the average line to span the full vertical height of the chart.
Tip: Setting the axis maximum to 1 is what creates the "full" vertical line effect; omitting this may result in a short line or misplaced overlay.

In Excel 2013 and later, you can directly enter 1 into the Maximum field in the Format Axis pane.
15. After closing the dialog, you’ll see the average vertical line added to your bar chart, visually marking the data's mean for quick comparison.

For further visual refinement, right-click the line and select Format Data Series to open formatting options for color, style, and thickness. Customizing these elements often improves presentation clarity or aligns with organizational branding.

Common troubleshooting tips include checking that your X and Y value ranges contain no blank cells and that you always select the correct cell ranges inside the Select Data dialogs. If the vertical line does not appear as expected, re-examine the chart type assignments or axis maximum setting, as these often cause visual discrepancies when not set correctly. If you modify source data, return to the formula cells and ensure references still match the intended data range.
VBA code solution: Add vertical/average line programmatically
For users who regularly update charts or build periodic reports, automating the process of adding a vertical or average line with VBA can save significant time. This method is especially useful when you manage multiple similar charts or need to update lines as data changes - eliminating the need to repeat manual steps. While the VBA approach requires macro-enabled workbooks and some comfort with the Visual Basic editor, it provides flexibility and efficiency.
Note: Confirm that your worksheet contains a bar chart before running this code.
1. Go to the Developer tab and click Visual Basic to open the Microsoft Visual Basic for Applications editor. If the Developer tab isn’t visible, see this guide: Show the Developer tab in Excel.
2. In the VBA editor, click Insert > Module to create a new module. Then, paste the following code into the editor window:
Sub AddAverageLineToBarChart()
    Dim cht As ChartObject
    Dim ws As Worksheet
    Dim dataRange As Range
    Dim avgValue As Double
    Dim i As Integer
    Dim nameSeries As String
    Dim xValues(1 To 2) As Double
    Dim yValues(1 To 2) As Double

    On Error Resume Next
    xTitleId = "KutoolsforExcel"

    Set ws = ActiveSheet
    Set cht = ws.ChartObjects(1) ' Use the first chart on the active sheet

    Set dataRange = Application.InputBox("Select the data range for average calculation", xTitleId, Type:=8)
    nameSeries = Application.InputBox("Name for the average series", xTitleId, "Average")

    avgValue = Application.WorksheetFunction.Average(dataRange)

    xValues(1) = avgValue
    xValues(2) = avgValue
    yValues(1) = 0
    yValues(2) = 1

    With cht.Chart
        .SeriesCollection.NewSeries
        With .SeriesCollection(.SeriesCollection.Count)
            .Name = nameSeries
            .XValues = xValues
            .Values = yValues
            .ChartType = xlXYScatterLines
            .AxisGroup = 1
        End With
    End With
End Sub
3 After entering the code, click the ![]() button to execute the macro. A dialog box will appear prompting you to select the data range for calculating the average, then specify a name for the average series. The macro will automatically add a vertical average line to the first chart object in your active sheet.
button to execute the macro. A dialog box will appear prompting you to select the data range for calculating the average, then specify a name for the average series. The macro will automatically add a vertical average line to the first chart object in your active sheet.
Tips: If you have multiple charts, adjust ws.ChartObjects(1) to target the correct chart index.
Best Office Productivity Tools
Supercharge Your Excel Skills with Kutools for Excel, and Experience Efficiency Like Never Before. Kutools for Excel Offers Over 300 Advanced Features to Boost Productivity and Save Time. Click Here to Get The Feature You Need The Most...
Office Tab Brings Tabbed interface to Office, and Make Your Work Much Easier
- Enable tabbed editing and reading in Word, Excel, PowerPoint, Publisher, Access, Visio and Project.
- Open and create multiple documents in new tabs of the same window, rather than in new windows.
- Increases your productivity by 50%, and reduces hundreds of mouse clicks for you every day!
All Kutools add-ins. One installer
Kutools for Office suite bundles add-ins for Excel, Word, Outlook & PowerPoint plus Office Tab Pro, which is ideal for teams working across Office apps.
- All-in-one suite — Excel, Word, Outlook & PowerPoint add-ins + Office Tab Pro
- One installer, one license — set up in minutes (MSI-ready)
- Works better together — streamlined productivity across Office apps
- 30-day full-featured trial — no registration, no credit card
- Best value — save vs buying individual add-in