How to average every 5 rows or columns in Excel?
When working with large datasets in Excel, it's common to need average calculations for every group of rows or columns—such as every5 rows or every 5 columns. While you could manually insert formulas like =AVERAGE(A1:A5), =AVERAGE(A6:A10), =AVERAGE(A11:A15), and so on, this quickly becomes impractical if your list contains hundreds or thousands of cells. Manually repeating these operations is both time-consuming and susceptible to errors. Fortunately, Excel offers multiple ways to automate this task, making data analysis much more efficient and less tedious. This article will introduce several practical methods for calculating the average of every 5 rows or columns, including formula-based approaches, Excel add-ins, VBA automation, and Pivot Table techniques, to help you choose the best solution for your scenario.
Average every 5 rows or columns with formulas
Average every 5 rows with Kutools for Excel
Average every 5 rows or columns with VBA code
Average every 5 rows with Pivot Table
Average every 5 rows or columns with formulas
If you prefer to use standard Excel formulas, you can automate the calculation for every 5 rows or columns without the need for add-ins or scripting. This approach is particularly suitable for static datasets where you simply need to generate sets of averages to support your analysis. However, care must be taken to correctly reference your data and handle any blank or irregular intervals.
The following example demonstrates how to calculate the average of every 5 rows in a column:
1. Enter the following formula into the first cell where you want the result (for instance, C2):
=AVERAGE(OFFSET($A$2,(ROW()-ROW($C$2))*5,,5,))Here, A2 is the starting cell of your data column, C2 is the formula output cell, and 5 is the interval (number of rows to average). Make sure to adjust these references according to your actual dataset.
After entering the formula, press Enter. The first averaged result will be displayed. See screenshot:

2. Select the formula cell, then drag the fill handle down until you encounter an error value (such as #DIV/0! if there are fewer than 5 values in the remaining data). This will automatically retrieve averages for each group of 5 rows. See screenshot:

Tips and Notes: You can use error-handling functions like IFERROR() to suppress error values if your data does not fit into perfectly-sized groups, for example:
=IFERROR(AVERAGE(OFFSET($A$2,(ROW()-ROW($C$2))*5,,5,)),"")To calculate the average every 5 columns across a row, apply the following formula (place in A3 and drag across):
=AVERAGE(OFFSET($A$1,,(COLUMNS($A$3:A3)-1)*5,,5))Here, A1 is the starting cell, A3 is your formula output cell, and 5 is the number of columns in each group. Adjust cell references as needed for your data layout.
After entering the formula and pressing Enter, drag the fill handle to the right until you reach an error value. See screenshot:

This formula-based method is ideal for quick one-off calculations or when you don't want to use additional tools. However, as your data changes in size or shape, you may need to adjust the formulas or manually update the cell ranges, and handling incomplete groups may require extra care.
Average every 5 rows with Kutools for Excel
Kutools for Excel provides a convenient graphical solution if you frequently need to average groups of rows without managing complex formulas. Through the Insert Page Break Every Row and Paging Subtotals functions, you can quickly segment your data and calculate batch averages in just a few clicks. This method is especially useful if you want to apply averages over repeatable intervals and visualize grouping directly in your worksheet.
After downloading and installing Kutools for Excel, please follow these steps:
1. Click Kutools Plus > Printing > Insert Page Break Every Row. See screenshot:

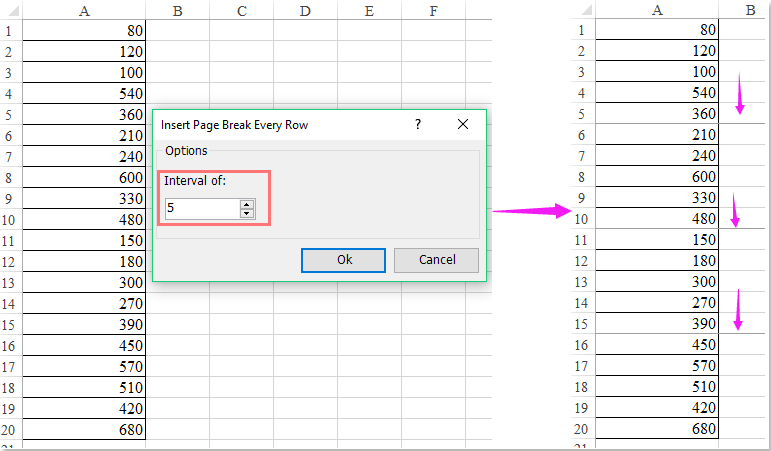
2. In the Insert Page Break Every Row dialog box, specify the interval (for example, 5) to insert a page break after every 5 rows. This lets Kutools segment your data automatically. See screenshot:
3. Next, click Kutools Plus > Printing > Paging Subtotals. See screenshot:

4. In the Paging Subtotals dialog, select the column(s) you'd like to average, then choose Average as the calculation method. See screenshot:

5. Click OK, and Kutools instantly inserts subtotal rows with average values at each 5-row interval. See screenshot:

Download and free trial Kutools for Excel Now !
Kutools makes repetitive data grouping and analysis easy to complete without needing to adjust formulas or write any scripts. However, please note that inserted page breaks might affect print layout and views, so you might want to remove them after use if they're not needed for your report.
Average every 5 rows or columns with VBA code
If you need to repeatedly calculate the average value for every fixed number of rows or columns across large or ever-changing datasets, automating this process with VBA can save a significant amount of manual labor. VBA allows you to loop through your data, group them as needed, and output the average result for each batch. This method is especially suitable for advanced users or those handling dynamic data blocks, and avoids formulas cluttering your worksheet. Below is a general-purpose VBA macro you can easily adapt.
Automate averaging every 5 rows:
1. Click Developer > Visual Basic to open the Microsoft Visual Basic for Applications window. Then, click Insert > Module and paste the code below into the module:
Sub AverageEvery5Rows()
    Dim DataRange As Range
    Dim OutputCell As Range
    Dim GroupSize As Integer, i As Integer, j As Integer
    Dim LastRow As Long, StartRow As Long
    Dim SumValue As Double, CountValue As Integer

    On Error Resume Next
    xTitleId = "KutoolsforExcel"

    Set DataRange = Application.InputBox("Select the data range to average (single column)", xTitleId, Selection.Address, Type:=8)
    Set OutputCell = Application.InputBox("Select the first cell for output", xTitleId, , Type:=8)
    GroupSize = Application.InputBox("Enter group size (e.g. 5)", xTitleId, 5, Type:=1)

    On Error GoTo 0

    If DataRange Is Nothing Or OutputCell Is Nothing Then Exit Sub

    LastRow = DataRange.Rows.Count
    StartRow = 1
    i = 0

    Do While StartRow <= LastRow
        SumValue = 0
        CountValue = 0

        For j = 0 To GroupSize - 1
            If (StartRow + j) <= LastRow Then
                SumValue = SumValue + DataRange.Cells(StartRow + j, 1).Value
                CountValue = CountValue + 1
            End If
        Next j

        If CountValue > 0 Then
            OutputCell.Offset(i, 0).Value = SumValue / CountValue
        Else
            OutputCell.Offset(i, 0).Value = ""
        End If

        StartRow = StartRow + GroupSize
        i = i + 1
    Loop
End Sub
2. To execute the code, click the ![]() button or press F5. Select your data range (one column), then choose the starting cell for the output, and specify the group size (e.g.,5). The macro will output the average for each set of5 rows, one below the other in the specified output column.
button or press F5. Select your data range (one column), then choose the starting cell for the output, and specify the group size (e.g.,5). The macro will output the average for each set of5 rows, one below the other in the specified output column.
You can use a similar macro to average every 5 columns across a row.
Automate averaging every 5 columns::
Sub AverageEveryNColumns()
    Dim DataRange As Range
    Dim OutputCell As Range
    Dim GroupSize As Long
    Dim totalCols As Long, totalRows As Long
    Dim startCol As Long, endCol As Long, outCol As Long
    Dim v As Variant
    Dim r As Long, c As Long
    Dim sumVal As Double, cntVal As Long
    Dim xTitleId As String
    xTitleId = "KutoolsforExcel"
    On Error Resume Next
    Set DataRange = Application.InputBox("Select the data range (single rows)", _
                                         xTitleId, Selection.Address, Type:=8)
    Set OutputCell = Application.InputBox("Select the first cell for output (results will spill to the right)", _
                                          xTitleId, , Type:=8)
    GroupSize = Application.InputBox("Enter group size (e.g. 5)", xTitleId, 5, Type:=1)
    On Error GoTo 0

    If DataRange Is Nothing Or OutputCell Is Nothing Then Exit Sub
    If GroupSize < 1 Then
        MsgBox "Group size must be >= 1.", vbExclamation
        Exit Sub
    End If
    Application.ScreenUpdating = False
    Application.EnableEvents = False
    Dim prevCalc As XlCalculation
    prevCalc = Application.Calculation
    Application.Calculation = xlCalculationManual

    totalCols = DataRange.Columns.Count
    totalRows = DataRange.Rows.Count
    v = DataRange.Value
    outCol = 0
    For startCol = 1 To totalCols Step GroupSize
        endCol = startCol + GroupSize - 1
        If endCol > totalCols Then endCol = totalCols
        sumVal = 0
        cntVal = 0
        For r = 1 To totalRows
            For c = startCol To endCol
                If Not IsEmpty(v(r, c)) Then
                    If IsNumeric(v(r, c)) Then
                        sumVal = sumVal + CDbl(v(r, c))
                        cntVal = cntVal + 1
                    End If
                End If
            Next c
        Next r
        If cntVal > 0 Then
            OutputCell.Offset(0, outCol).Value = sumVal / cntVal
        Else
            OutputCell.Offset(0, outCol).Value = ""
        End If
        outCol = outCol + 1
    Next startCol
CleanExit:
    Application.Calculation = prevCalc
    Application.EnableEvents = True
    Application.ScreenUpdating = True
End Sub
Average every 5 rows with Pivot Table
Another practical way to calculate group averages every 5 rows is by using a Pivot Table, combining it with a sequence numbering or index column to group the data. This method is particularly useful for users who work with structured, table-based data and need a quick, interactive summary without writing formulas or using add-ins. A Pivot Table dynamically handles data changes and supports flexible grouping—great for large datasets or regular reporting tasks.
Here’s how to perform this operation using a helper column and a Pivot Table:
1. Add an "Index" or "Group" column next to your data to mark each group of 5 rows. In the first data row (B2), enter:
=INT((ROW()-ROW($A$2))/5)+1This formula labels each row in sequence, assigning the same group number to every 5 rows. Fill this formula down alongside your dataset.
2. Select your data and the new Index column, then click Insert > PivotTable. In the PivotTable creation dialog, confirm your data range and choose where to place the Pivot Table.
3. In the newly created Pivot Table field list, drag the "Group" field to the Rows area, and your value field (e.g., "Sales") to the Values area.
4. Click the dropdown in the Values area, choose Value Field Settings, and select Average.
Now, your Pivot Table shows the average for every 5 rows of the original data, grouped conveniently by the helper column.
Key benefits of the Pivot Table method are its flexibility and easy updates when your source data changes. However, it requires adding a helper column, and may not suit situations where data needs to remain precisely formatted or unaltered.
Related articles:
How to average last 5 values of a column as new numbers entering?
How to average top or bottom 3 values in Excel?
Best Office Productivity Tools
Supercharge Your Excel Skills with Kutools for Excel, and Experience Efficiency Like Never Before. Kutools for Excel Offers Over 300 Advanced Features to Boost Productivity and Save Time. Click Here to Get The Feature You Need The Most...
Office Tab Brings Tabbed interface to Office, and Make Your Work Much Easier
- Enable tabbed editing and reading in Word, Excel, PowerPoint, Publisher, Access, Visio and Project.
- Open and create multiple documents in new tabs of the same window, rather than in new windows.
- Increases your productivity by 50%, and reduces hundreds of mouse clicks for you every day!
All Kutools add-ins. One installer
Kutools for Office suite bundles add-ins for Excel, Word, Outlook & PowerPoint plus Office Tab Pro, which is ideal for teams working across Office apps.
- All-in-one suite — Excel, Word, Outlook & PowerPoint add-ins + Office Tab Pro
- One installer, one license — set up in minutes (MSI-ready)
- Works better together — streamlined productivity across Office apps
- 30-day full-featured trial — no registration, no credit card
- Best value — save vs buying individual add-in