How to count unique values based on multiple criteria in Excel?
In many practical scenarios, it's often necessary not just to count values, but to determine how many unique items meet certain conditions within your data. For example, you may want to find out the count of different products a particular sales person sold, or how many unique orders were placed within a certain timeframe. Handling such tasks efficiently in Excel requires familiarizing yourself with suitable formulas, advanced features like pivot tables, or even custom VBA solutions. In this article, we will explore several practical methods to count unique values based on one or more criteria, with step-by-step instructions and tips.
Count unique values based on one criteria
Count unique values based on two given dates
Count unique values based on two criteria
Count unique values based on three criteria
Count unique values with Pivot Table (Distinct Count, Excel2013+)
Count unique values with VBA Code (for complex/automated cases)
 Count unique values based on one criteria
Let's consider a common case: you want to count how many different products were sold by Tom. This method is suitable when you have a simple dataset and aim to evaluate the uniqueness based on a single condition, such as a single person's sales records. It's straightforward but requires careful use of array formulas.
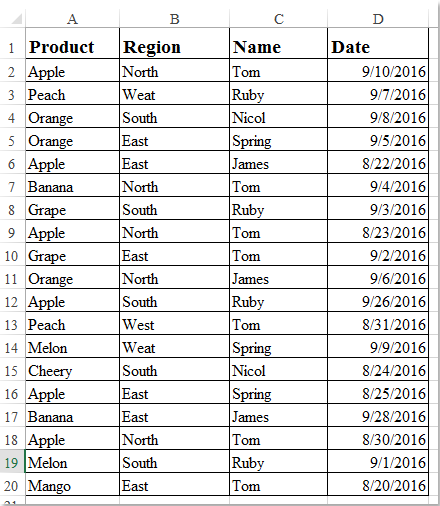
For this scenario, enter the following formula into a blank cell (for example, cell G2):
=SUM(IF("Tom"=$C$2:$C$20,1/(COUNTIFS($C$2:$C$20, "Tom", $A$2:$A$20, $A$2:$A$20)),0))
After typing the formula, press Ctrl + Shift + Enter (not just Enter) to confirm it as an array formula. The curly braces will appear around the formula in the formula bar, and you'll see the result instantly as shown below:
Note:
- “Tom” is the condition you want to use to filter the results. You can replace "Tom" with a reference to another cell (e.g., $F$2) if you want more flexibility.
- $C$2:$C$20 contains the salesperson’s names to be evaluated.
- $A$2:$A$20 is the product column for which you want unique counts.
- If your data range changes, remember to adjust the references accordingly.
Tip: If using Excel 365 or Excel 2019 and later, you can try using UNIQUE and FILTER functions for easier formulas.
If you encounter any #DIV/0! errors, double-check the criteria and ensure that your ranges are equal in length.
Count unique values based on two given dates
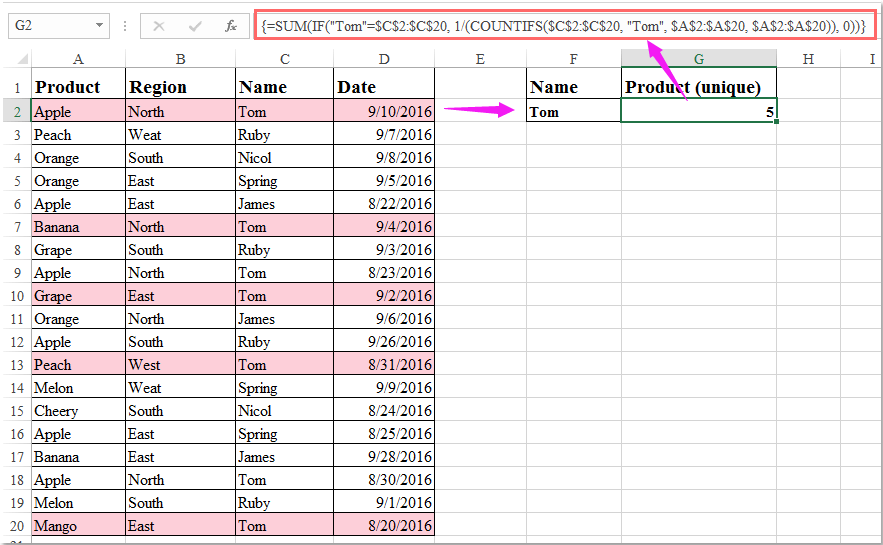
When you need to find the number of unique items within a specific date range, for example, all unique products sold between 2016/9/1 and 2016/9/30, you can apply this approach. This is especially useful when analyzing data trends between certain periods, such as monthly, quarterly, or custom date ranges. However, be cautious with date formatting; it must match your worksheet’s date values.
Place the following formula in a blank cell where you want to display the result:
=SUM(IF($D$2:$D$20<=DATE(2016,9,30)*($D$2:$D$20>=DATE(2016,9,1)),1/COUNTIFS( $A$2:$A$20, $A$2:$A$20, $D$2:$D$20, "<="&DATE(2016,9,30),$D$2:$D$20, ">="&DATE(2016,9,1))),0)
Press Ctrl + Shift + Enter after entering the formula to execute it as an array formula. The screenshot below demonstrates the result:
Note:
- 2016,9,1 and 2016,9,30 are the start and end date criteria. You can modify these as needed, or even use cell references for dynamic date filters.
- $D$2:$D$20 contains the date entries to be checked.
- $A$2:$A$20 is again the item or product column you wish to count uniquely.
- Make sure your dates are stored as valid Excel dates, not text strings. If your result doesn’t appear as expected, confirm your date formatting and ranges.
Tip: Use DATE(year, month, day) to avoid issues with regional date formatting. When using dynamic ranges, consider using named ranges for clarity.
Count unique values based on two criteria
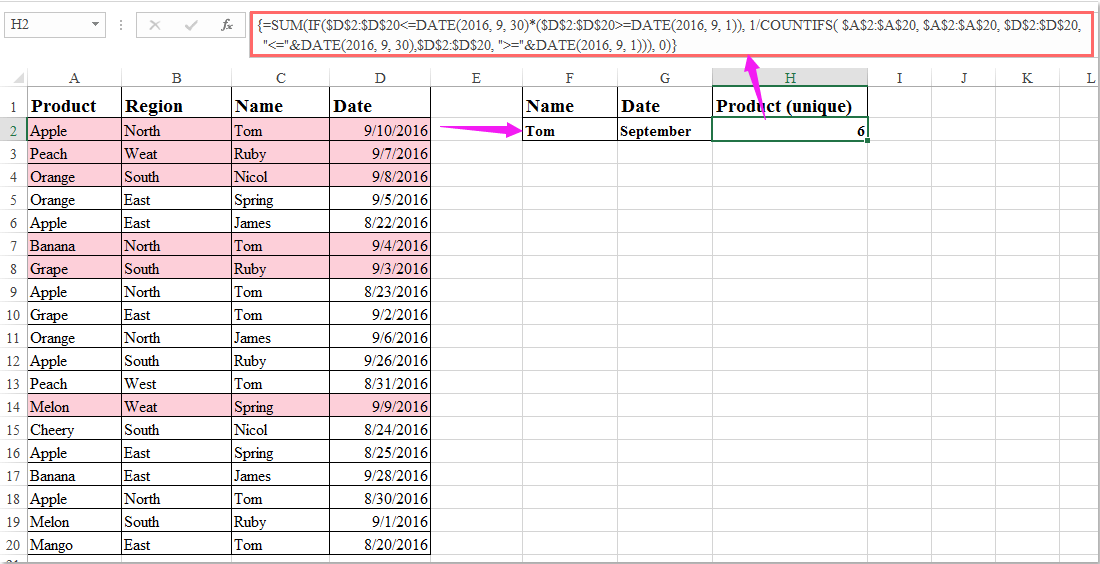
Suppose you want to analyze only the products that Tom sold within September, combining name and a date range into your unique count. This scenario is common for period-based performance reviews or segmented analyses. As your criteria expand, the formula grows more complex, and attention to data accuracy becomes even more important.
Input the formula below into any blank cell, such as H2:
=SUM(IF(("Tom"=$C$2:$C$20)*($D$2:$D$20<=DATE(2016,9,30)*($D$2:$D$20>=DATE(2016,9,1))),1/COUNTIFS($C$2:$C$20, "Tom", $A$2:$A$20, $A$2:$A$20, $D$2:$D$20, "<="&DATE(2016,9,30),$D$2:$D$20, ">="&DATE(2016,9,1))),0)
After typing the formula, confirm it with Ctrl + Shift + Enter. You should see the unique count immediately; check the following illustration:
Notes:
- “Tom” is the name criterion, while “2016,9,1” and “2016,9,30” are your date range boundaries. Adjust as required or make them dynamic with cell references.
- $C$2:$C$20 is the staff (or another first criterion) column; $D$2:$D$20 is the date column; $A$2:$A$20 contains the unique items to count.
- Ranges must all be of equal length to prevent errors.
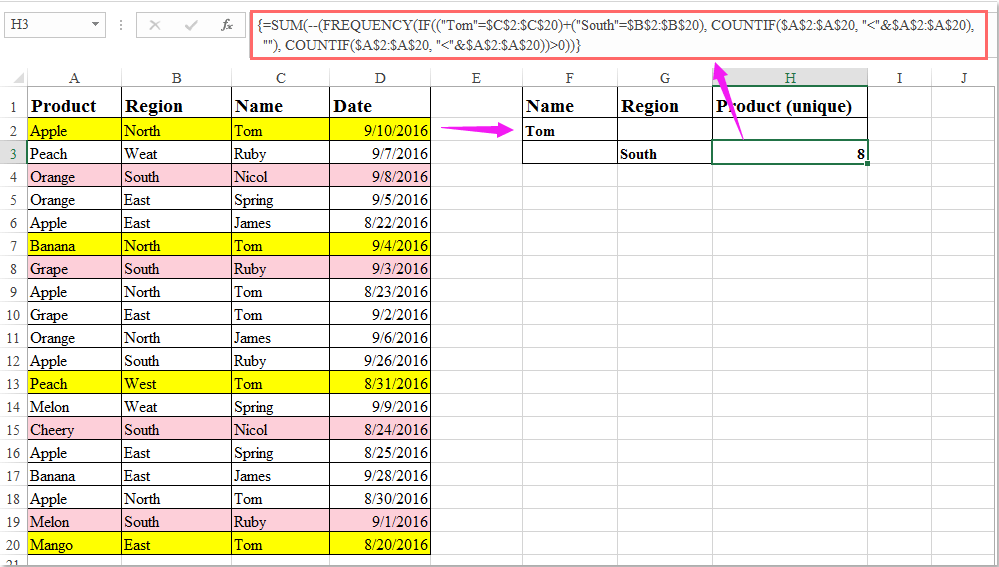
If you wish to use “or” conditions, such as counting unique products sold by Tom or in the South region, you can use the following formula. This enables broader search conditions, though results may overlap if data matches both criteria:
=SUM(--(FREQUENCY(IF(("Tom"=$C$2:$C$20)+("South"=$B$2:$B$20), COUNTIF($A$2:$A$20, "<"&$A$2:$A$20), ""), COUNTIF($A$2:$A$20, "<"&$A$2:$A$20))>0))
Don’t forget to press Ctrl + Shift + Enter. You’ll see the results as shown below:
Tip: When applying OR criteria, be aware of possible double-counting if the same record satisfies both conditions. For large datasets, performance may be affected.
Count unique values based on three criteria
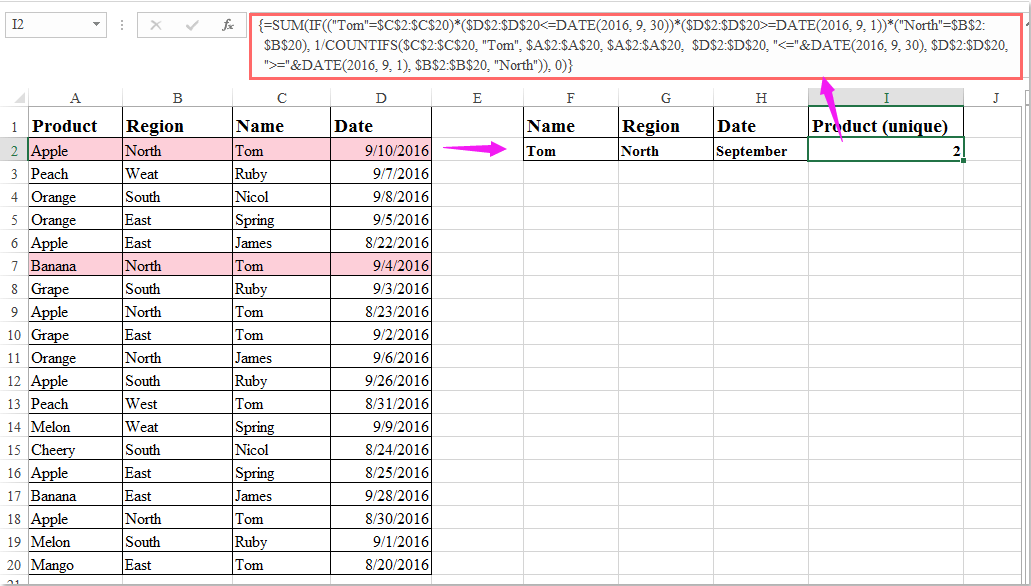
Sometimes your analysis might require three or more conditions, such as determining unique products sold by Tom in September only in the North region. This is common in multi-dimensional data analysis for reporting or targeted business insights. Careful reference management is essential in handling such compound logic.
Place this array formula in a blank cell (e.g., I2):
=SUM(IF(("Tom"=$C$2:$C$20)*($D$2:$D$20<=DATE(2016,9,30))*($D$2:$D$20>=DATE(2016,9,1))*("North"=$B$2:$B$20),1/COUNTIFS($C$2:$C$20, "Tom", $A$2:$A$20, $A$2:$A$20, $D$2:$D$20, "<="&DATE(2016,9,30), $D$2:$D$20, ">="&DATE(2016,9,1), $B$2:$B$20, "North")),0)
Press Ctrl + Shift + Enter to finish. Here’s a sample result for reference:
For advanced conditions, double-check that all ranges are consistent and that the data types (e.g., date and text) are correct. Misalignments can cause errors or misleading results.
Tips:
- If you encounter performance issues on large datasets, consider breaking down the formula or using Excel’s Pivot Table solution.
- Named ranges or referencing cells for all criteria improves readability and reduces formula errors.
- For frequent use, consider recording these formulas in named cell references or custom functions.
Count unique values with Pivot Table (Distinct Count, Excel 2013+)
For users of Excel 2013 or later, Pivot Tables offer a more interactive, non-formula alternative to counting unique values across one or multiple criteria. The Distinct Count feature helps you summarize and filter large data sets efficiently, making this method especially suitable for dynamic, report-based environments. However, note that earlier versions of Excel do not support the Distinct Count function within Pivot Tables.
How to use this method:
- Select your dataset and go to Insert > PivotTable.
- In the Create PivotTable dialog box, choose where to place the PivotTable, check the "Add this data to the Data Model" box, and then click OK.
- Drag the field you want to count uniquely (e.g., Product) into the Values area. By default, it will display as "Count of...".
- Click on the field in the Values area and select Value Field Settings.
- In the pop-up dialog, scroll down and select Distinct Count (This option is available only in Excel 2013 or later, and appears when the PivotTable is created with the "Add this data to the Data Model" option enabled.).
- Add your criteria fields (e.g., Salesperson, Region, Date) to the Filters or Rows/Columns area to apply single or multiple conditions.
- Your PivotTable will now display the unique count of values filtered by your chosen criteria.
Advantages: Highly visual, easy to adjust filters without editing formulas, and suitable for interactive reporting.
Limitations: Not available in Excel 2010 or earlier; adding new data requires manually refreshing the PivotTable.
Practical tip: Always ensure the source data has no duplicates within the same record if they're not intended. If you find the Distinct Count option missing, re-create the PivotTable and check the “Add this data to the Data Model” option.
Count unique values with VBA Code (for complex/automated cases)
Sometimes, you may need to count unique values based on various criteria automatically, especially when handling very large datasets or when repeating the analysis frequently. A VBA macro is ideal for such situations, as it can quickly process different logic—including multi-condition filtering—without manual intervention after setup. However, VBA is more advanced than regular Excel features, so it's best used by users comfortable with macros or those with ongoing analytical needs.
Operation steps:
- Press Alt + F11 to open the VBA editor. In the editor, select Insert > Module to create a new module.
- Copy and paste the following VBA code into the module:
Sub CountUniqueWithCriteria()
    Dim DataRange As Range
    Dim CriteriaRange As Range
    Dim CriteriaValue As Variant
    Dim Dict As Object
    Dim i As Long
    Dim UniqueCount As Long
    Dim ResultCell As Range

    Set Dict = CreateObject("Scripting.Dictionary")

    ' Prompt for range settings
    Set DataRange = Application.InputBox("Select data range (items to count):", "KutoolsforExcel", Type:=8)
    Set CriteriaRange = Application.InputBox("Select criteria range (e.g. Salesperson):", "KutoolsforExcel", Type:=8)
    CriteriaValue = Application.InputBox("Enter criteria value:", "KutoolsforExcel", "", Type:=2)
    Set ResultCell = Application.InputBox("Select cell for result output:", "KutoolsforExcel", Type:=8)

    On Error Resume Next
    For i = 1 To DataRange.Rows.Count
        If CriteriaRange.Cells(i, 1).Value = CriteriaValue Then
            If Not Dict.Exists(DataRange.Cells(i, 1).Value) Then
                Dict.Add DataRange.Cells(i, 1).Value, 1
            End If
        End If
    Next i

    UniqueCount = Dict.Count
    ResultCell.Value = UniqueCount

    MsgBox "Unique count for '" & CriteriaValue & "': " & UniqueCount, vbInformation, "KutoolsforExcel"
End Sub- Close the VBA editor and return to your worksheet. Press Alt + F8, select CountUniqueWithCriteria, and run the macro.
- Follow the input prompts to specify the ranges and criteria according to your data. The result will appear in the cell you choose and also as a message box.
Parameter explanation and notes:
- This macro is currently set up for one criterion. To extend it for multiple criteria, modify the
If ... Thenlogic inside the loop. - Always save your workbook before running macros as changes are not undoable.
- Enable macros in your Excel settings if you encounter execution errors.
- This method works well for larger or frequently-updated data where manual formulas would be cumbersome.
Benefits: Highly customizable and automatable, handles large and changing datasets efficiently. Suitable for advanced or repeated workflow needs.
Drawbacks: Requires macro permissions, and beginners may need time to familiarize themselves with VBA operations.
When working with unique value counts based on criteria, always confirm your range references and ensure all criteria columns are aligned in size. Mismatched ranges are a common source of errors or incorrect results. If formulas return unexpected results, check for hidden formatting issues or blank cells. For performance-critical scenarios, Pivot Tables and VBA provide robust alternatives to array formulas. Choose the solution best suited to your comfort level and your dataset’s complexity. Remember, Kutools for Excel provides additional utilities and shortcuts that can streamline many of these tasks for even greater efficiency in complex workbooks.
Best Office Productivity Tools
Supercharge Your Excel Skills with Kutools for Excel, and Experience Efficiency Like Never Before. Kutools for Excel Offers Over 300 Advanced Features to Boost Productivity and Save Time. Click Here to Get The Feature You Need The Most...
Office Tab Brings Tabbed interface to Office, and Make Your Work Much Easier
- Enable tabbed editing and reading in Word, Excel, PowerPoint, Publisher, Access, Visio and Project.
- Open and create multiple documents in new tabs of the same window, rather than in new windows.
- Increases your productivity by 50%, and reduces hundreds of mouse clicks for you every day!
All Kutools add-ins. One installer
Kutools for Office suite bundles add-ins for Excel, Word, Outlook & PowerPoint plus Office Tab Pro, which is ideal for teams working across Office apps.
- All-in-one suite — Excel, Word, Outlook & PowerPoint add-ins + Office Tab Pro
- One installer, one license — set up in minutes (MSI-ready)
- Works better together — streamlined productivity across Office apps
- 30-day full-featured trial — no registration, no credit card
- Best value — save vs buying individual add-in